Achieving IT Value
Its 8:11a, its smoggy, the traffic is bumper to bumper, and John finds himself irritated again that he missed his usual morning window to get into work. He's always been amazed by the patterns of traffic coming in from the suburbs towards downtown. If he manages to get out of the house by 7:00a he can usually beat the worst of it on his way in. But when he's late by even 15 minutes— as he is today—that changes the whole ballgame to become exactly what he's seeing right now: gridlock.
"Beep, beep."
The sound of his pager wakes him out of his highway hypnosis. Though he promised his wife to stop checking the thing while driving, he reaches for it from his belt during a particularly slow spot in the drive.
B2B web application failed, 200 north america users impacted, root cause: core router outage
"Well, look what we have here," he remarks to nobody in particular, "I remember the last time this problem happened. We're a little more prepared for it this time. Let's just see how the team takes care of it this time."
John realizes that sitting stuck in traffic means that there's little he can do to assist with the problem. He might call to the Help desk here in 10 or 15 minutes, just to check in on their status. But he realizes that calling in too much just takes away people's time from fixing the problem rather than really helping all that much. Plus, maybe they'll just call him.
Over a year ago, back before FCG implemented its BSM system, they experienced a problem quite a bit like this one. What John originally saw as a "minor IT system" actually turned out to be a major component in a system he admits now he didn't really understand. His team got that server back to operations—but not without incurring nearly 8 hours of downtime for what ended up being their entire business-to-business Web site. It was a fairly big black mark on his otherwise solid record with FCG. That black mark and the resulting fallout was what eventually drove the incorporation of BSM into the IT operations environment.
What John didn't realize at the time was just how far BSM would penetrate into his daily operations. Now today, over a year later, its tendrils are hooked into virtually every part of his operating environment. Databases, network devices, server physical characteristics, and even the applications and their individual transactions are all a part of this massive monitoring system. He finds himself constantly amazed at how the thing keeps up with all the data. But his engineers tell him that is one of the biggest jobs of the whole thing—simply analyzing and throwing away data that isn't useful.
"Beep, beep."
Whoa! Have 15 minutes gone by that fast? He checks his watch and again sees the IT value in the system, recognizing that with just a little bit of daydreaming he's already burned a quarter of his available monthly downtime.
Hey john, DEN-RTR-02B-H died again. Rebooting it fixed the problem. See you when you get in.
"The same router!" John exclaims to nobody in particular as he nudges the car forward another 10 feet, "…and now Network Ops is paging me to let me know they've already resolved the problem. Now, that's just impressive. Dan's gonna' love this story."
Back before the incorporation of their BSM system, there's no way they would have been able to track down, troubleshoot, and locate something such as a router causing an application to experience transaction failures on that B2B system instantaneously. They must be using the new drill-down menus his BSM engineering team added to the system a few months ago.
Beaming with pride in his team and his decision to go with the BSM solution, John gets off the highway at the next exit and stops for bagels. "This one deserves breakfast on me," he thinks to himself as he hears his cell phone ring, "Heh. And there's the team, calling to gloat 'cause it's already fixed."
Proving IT Value with BSM
We've spent a lot of time in this guide discussing the output side associated with a BSM implementation. Dashboards, visualizations, and actionable information that IT and the business can use to make effective decisions and troubleshoot problems are all useful and easy-to-see results from a BSM implementation. They're also arguably the more exciting part. Seeing a BSM implementation's visualizations and understanding how they can be used effectively is easily the most impressive part of the concept. But as you can see in Figure 8.1, that output side is only one-third of the entire process.
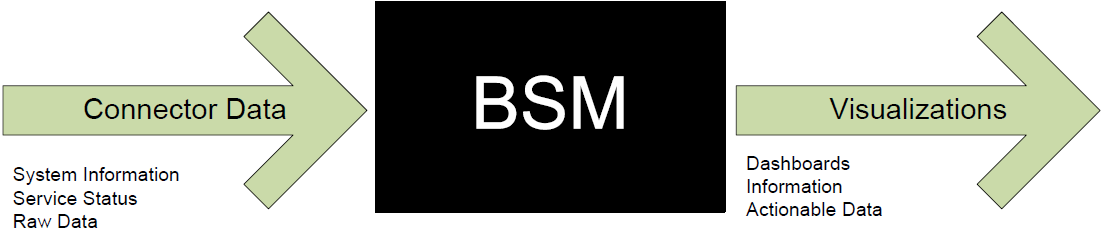
Figure 8.1: BSM's visualizations and output information are only as good as the data ingested into the system and the calculations made on that data.
Bringing importance and value to the output from the system is the information that got you to those ultimate conclusions. The data collected by the End User Experience (EUE) monitoring product in combination with data from other management systems is the raw material that is fed into the BSM calculations engine—the center black box. Once those connections are set up and fully understood from a data perspective, the next step is to model the data to give it meaning. How the results of those calculations are interpreted is what ultimately drives what its end users see.
In this chapter, we'll talk about both of these pieces. Having already gone through a thorough discussion of the importance of EUE monitoring back in Chapter 5, this chapter will dig deep into the individual connectors that link into other IT systems. Understanding those, we'll also take a look at some sample calculations and how those calculations are built to feed BSM's visualizations.
Before we get into either of these two topics, let's talk at a very general level about the types of input data typically brought into a BSM system to feed data to calculations. We can align this data collection under five general categories: service desk data, configuration data, response time data, infrastructure metrics data, and business data.
Service Desk Data
Service desk data illuminates the connection between people and the technology associated with the management of an IT system. Service desk data incorporates the sum total of knowledge as well as the daily mapping of activities of an IT organization. Thus, its use is handy for tracking IT movement and prioritization across its various activities. This data usually provides useful information about:
- Ticketing and work order tracking data. What types of problems are being worked on? Which systems are seeing issues and which systems operate without problems? Is there a correlation between maintenance activities and problems?
- Timing data. When do problems occur? Are there correlations between day/date/time and the level of problems found within the environment?
- Time-to-identify metrics. How long after a problem occurs does it take to begin working on the problem? Are resources effectively being assigned to problems?
- Time-to-resolve metrics. Once work begins on a problem, how long does it take to resolve the issue? Are current assets trained sufficiently to resolve problems quickly?
Service desk data arrives through external sources such as service desk systems and workflow tracking systems.
Configuration Data
Configuration data provides information about the settings used within the system as well as the interconnections between disparate components that make up the greater system as a whole. Configuration data is particularly useful in the development and evolution of the service model over time. This data provides useful information about:
- System baseline data. What is the configuration of the system? How has that configuration changed over time? Configuration data can also be used to identify and maintain a baseline for the system. This enables changes to that baseline to be tracked as appropriate.
- Root cause analysis. In the end, what really happened? When baselines are understood, it is possible to seek out differences in that baseline to see where inadvertent changes may have been met. It also facilitates the inclusion of outside troubleshooting such as vendor support by providing hard copy evidence of a system's composition and current configuration.
Configuration data arrives through external sources such as server management systems, patching and application management systems, and through asset and configuration management databases .
Response Time Data
As we discussed in Chapter 5 on EUE, response time data is crucial business-focused metric to BSM's determination of service quality. Knowing just how many transactions are working their way through the system, where those transactions are bottlenecking, and what may be the cause is a key result of BSM's data calculations. This data provides useful information about:
- Time-to-complete metrics. For each step along the way for any particular transaction, what is the measurement of completion? How many steps are in the process? What is the breakdown of time for each step between network, system, and client ownership?
- User delay metrics. When users are working with the system, where do they find themselves pausing or stopping the process of their own accord? When are users confused and when are they considering options? Is the system's visual design a hindrance or a help to users?
- "CNS Spread" metrics. In what subsystem is the problem? As discussed in the bullet point earlier, timing information can usually be broken down between the time where the client is considering a request, the network is transmitting a request, and the server is processing a request. We learned in the chapter example that this spread of timing information can quickly pinpoint the source of transaction failures.
- "What" and "Who" metrics. Which applications and transactions as well as how many users were affected by the problem.
Response time data arrives usually through internal sources such as EUE monitoring but can also arrive from external sources such as Web traffic monitoring systems and application monitoring systems.
Infrastructure Metrics Data
Going hand-in-hand with response time data are the additional metrics that typically come out of infrastructure monitoring systems. The combination of these two types of data is critical to getting a full picture of what's going on within the IT system. In contrast with the response time data discussed preciously, this data provides useful information about:
- Downtime. When response time increases significantly, is it due to a problem with a functioning system or one that has completely gone down. What component of the greater system is down and how is that outage affecting the ability for the system to do its job?
- Physical characteristics. Computer systems can be extremely intolerant of physical characteristics, especially at the far ends of the scale. Is the system experiencing a temperature overage? Is the relative humidity below specifications, which could increase the chance of an electrical spark?
- Physical Response Time. Although transaction response time information is useful for understanding the behavior of individual packets of data, what is the overall health and transmission rate of the computers and network itself? Are the servers experiencing a high total processor load? Has memory been overcommitted? Is page file swapping causing an inappropriate drop in performance? Is the overall network bandwidth saturated or is there an acceptable amount yet available?
Infrastructure metrics data arrives through external sources such as systems and network monitoring systems.
Business Data
Last is the integration of all this technical data with the business' financial data. This information helps to highlight the business impact associated with poor service quality. It provides a financial measurement to assist IT and the business with decision making and prioritization. It fills out the BSM picture with information about:
- User impact. How many users are being impacted through the outage of a particular system or system component?
- Revenue impact. When service quality degrades, how does this impact the ability for the business to bring in cash flow? When service quality is nominal, what is the expected cash flow and what is the actual cash flow? Are revenue problems due to other nontechnical considerations such a product positioning or system design?
- Budget impact. What is the rate of expenditures and how does that rate relate to what is planned in the budget? Is funding being spent effectively to ensure enough money will be available at the end of the year? Have efficiencies in spending freed monies for additional purchases?
- Business activity. How much activity has occurred for a certain time period? For example, how many loan applications were initiated or how many stock trades have occurred?
Business data arrives through external sources such as financial systems, budgeting systems, and static data inputted into calculations. It's worth mentioning that this type of data, different than many of the other types we've discussed this far, usually involves the input of financial or business managers outside IT.
Leveraging the Service Model
More so than any other group within the business, IT stands to gain the most through direct access to the service model itself. The service model is intended to be a deconstructed representation of the system itself, with each of its entities broken down into their disparate components with as much granularity as possible. As we discussed back in Chapter 4, the service model is not a static construct, but one that is gradually updated over time to mirror the composition of the system.
IT systems are large and complex, especially those that face external customers due to the needs for high availability in tandem with security and customer isolation. Thus, as was the situation with John in our chapter example, it is likely that few within IT truly understand the overall reach of the system and how each component integrates with the others. Because of these complexities, the service model becomes a sort of "map" that assists IT with recognizing and working with those interconnections.
Along these lines, let's talk about how the service model grows to become of great use to IT. That utility comes in various forms through the linkages that make up the model, the traversal of those linkages through flow-up and flow-down dependencies, the ability to generate root cause diagrams when problems occur, and how integration of the model with worldwide time can illuminate the global impact associated with failures.
Business Service Linkages
The service model itself holds particular value for IT, but the real information for troubleshooting IT problems comes from the linkages between the individual components that make up the business service. Take a look at Figure 8.2. In this example, we're looking at a generic example of a service model that has all of its identifiers removed. Even with the metadata information removed from this image, the trained eye can immediately see from this image that a problem in a low-level system has impacted upper-level systems to some degree. The business service as a whole, as represented by the top-level circle in the image, is also impacted to some degree.
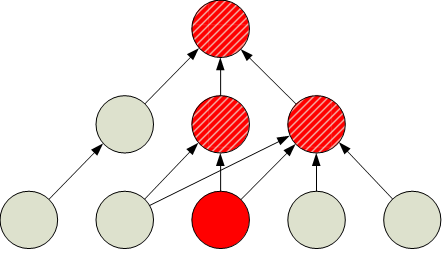
Figure 8.2: A generic service model without identifiers shows how a failure in a dependent system affects all those that rely on that system.
The IT professional will immediately see the most obvious result—that the business service "is having a problem"—by noticing the stoplight chart in Figure 8.2. What they would not otherwise have been able to ascertain without these linkages is how that top-level problem is being driven by problems lower down in the stack.
Flow-Up and Flow-Down
The importance of the arrows in Figure 8.2 cannot be understated because there is a substantial amount of data that goes into ensuring the relevance of each arrow. A fully realized service model also includes a set of service level "assumptions" at each level in the model. These assumptions are manifested as relationships that are critical to the development of the model. These relationships speak specifically to the IT process maturity we talked about back in Chapter 2. For the model to provide the necessary level of information to its users, this instructive data must be added to each element.

Figure 8.3: Zooming in on just the elements of concern in Figure 8.2, we recognize logical metrics that define the state of each element. These logical metrics are what drive the model's interactivity.
For example, Figure 8.3 drills down into the generic model we discussed in Figure 8.2. To this closer view, we now add logical metrics that are applied to each element—circles and arrows alike—that drive the explanation of their state. The router is not performing to its needed level of service. This is occurring because of numerous errors currently being seen on that router. Though the front-end and database subsystems are performing normally, the network problem is feeding into their ability to transfer data between each other. This reduction in front-end to database transaction performance is what ultimately is driving the failure of the system to meet its desired level of service. Though no numbers are attached to each of these elements in Figure 8.3, a fully realized model will include numbers that define what is considered the necessary level of service.
It's important to restate that the model itself as well as the calculations that go behind that model remain organic. As an example, the business may initially think that an error rate of 15 errors per second is acceptable, but later on determine that a much lower error rate is actually acceptable in order to meet service expectations. This information can change based on new information from vendors, updates to the business service itself, optimizations in code, or patches that change element behavior.
Root Cause Diagrams
There is a problem with this view of the model, however. All this data can be difficult to digest when it is not aligned in a logical fashion that makes sense to its troubleshooters. For this reason, additional views of issues need to be relayed using a dependent/antecedent layout. This type of diagram provides an effective tool for the troubleshooter to see how the interrelation of subsystems is affected by the problem at hand.

Figure 8.4: Another view of the service model that focuses on the problem at hand. This view is used to easily show root causes.
Figure 8.4 reformats much of the information shown in the drill-down view of Figure 8.3. Here, we see that the overall problem, "Transaction Performance" for the entire system is affected by a number of factors. Performance on the two systems appears to be normal, but connectivity between them is being impacted by a router that is experiencing errors. Here, we can easily drill down from our major problem to other conditions that are occurring simultaneously in the system. An actual view from a BSM system will also include the relevant data that justifies the determinations made in the figure.
All this is possible only when the service model is properly populated with the necessary numerical information for expected behaviors. Regardless of the type of BSM system chosen, the system should provide a way in which this numerical information is added to the service model.
Another benefit is that the same information that assists IT with troubleshooting also provides value to business leaders in their views. Though the visualizations given to business leaders will be quite a bit different than those used by the Help desk and administrators, all this data is used by the system in multiple ways.
Our discussion is still at a very high level. We still haven't discussed the actual numbers themselves. In the following section, we'll explore specific examples of the expressions and calculations that are often applied to each of these elements.
Business Calendar Diagrams
Lastly, one special class of visualization used in conjunction with those discussed earlier are Business Calendars. These visualizations are not necessarily directly used in the troubleshooting of problems but more so in determining a problem's impact in relation to global operations.
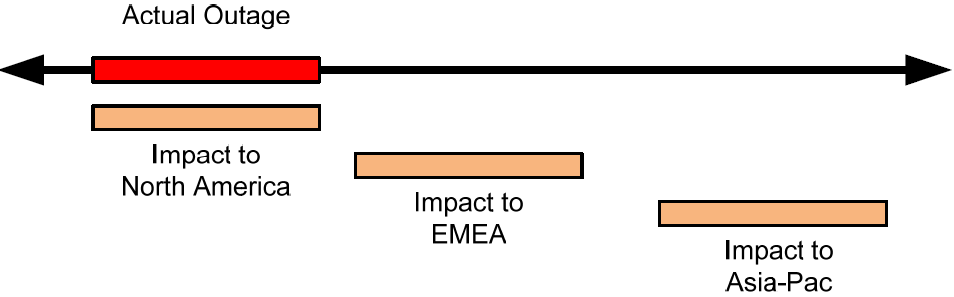
Figure 8.5: In this image, taken from Chapter 1, the business calendar tracks the timeframe associated with a problem in relation to the users across the globe. A problem that happens at one point in the day will affect users in different time zones in different ways.
Consider the problem of global Internet availability in relation to servicing customers across all 24 hours in a day. Users for a particular service may only make heavy use of that service from the hours of 8:00a to 5:00p. During the other hours of the day, usage is considered low. This is easy when users of the system all lie in the same or very near time zones. For continental North America, the time zone skew between its west and east coast is a mere 4 hours. Thus, the complete hours of operation across all time zones in our example are more like 6:00a to 7:00p depending on the location of the service.
Extrapolate this situation to a service that is used at those same times but in Europe, the Middle East, and Africa (EMEA) or also to users in the Asia-Pacific regions. Those regions consume roughly all the time zones spread across the dial of the clock. So, as you can see in Figure 8.5, once usage for North America spins down for any particular evening, it is beginning to spin up for users in EMEA. The same thing happens when EMEA is done for the night and Asia-Pacific users begin their workday.
Because of this time skew of users across the clock, three things are critically important to global operations of a business service:
- Peak and off peak operating periods. Different time periods are not created the same. Businesses have known peak and off-peak periods that drive the level of impact associated with issues. For example, retail operations have higher-than-normal loads during holidays while online systems typically see higher loads during lunch hours and at the conclusion of the work day. It is important to understand business time periods in order to best predict the impact of any issues.
- Planned downtime. IT has a need to regularly bring systems down for maintenance. When the process of bringing down those systems involves an impact to the user, it is important to know the best times to start and finish the activity. Based on usage patterns across the globe and the incorporation of the business calendar into that usage, IT can exercise good judgment in finding outage windows that affect users the least.
- Unplanned downtime. With unplanned downtime, the time of day in which that problem occurs can have a significant bearing on the ultimate impact to the business. An outage that occurs in the middle of the night for North America is actually happening at the start of the workday for EMEA, and so on. Relating the business calendar to financial information helps determine which area of the world is impacted and to what extent.
Balanced Scorecards
Though designed for use elsewhere outside the world of IT, balanced scorecards can be an effective tool to assist IT teams with understanding the relevance and impact of their decisions and actions. Balanced scorecards are a tool whereby formal measurements are given to management concepts within the organization. They provide a system of control and a quantitative analysis of performance and behaviors across multiple perspectives. We talk about them here because the use of balanced scorecards is highly data driven, and the collection and computation of that end-result data can be highly complex without automated systems.
With balanced scorecards, a multi-perspective approach is critical to management because decisions made to benefit one group can inadvertently negatively impact another. As an IT example, the addition of a new security control to an existing business system may provide greater control and added security to the system but at the cost of usability. The balanced scorecard assists IT with understanding from a numerical perspective how that change is felt across multiple perspectives.

Figure 8.6: The balanced scorecard model, showing its four axes and relevant focuses associated with the connection of each.
Four Perspectives
As Figure 8.6 shows, balanced scorecards look at the interrelation of metrics from four perspectives: financial, customer, innovation and learning, and internal. Where this model finds its biggest value is in the manipulation of impact associated with changes to the system. If a change to the system for purposes of improving a process (like our security control example earlier) dramatically reduces the ability for customers to interact with the system, the balanced scorecard may result in a net loss of customer satisfaction along with a loss of revenue.
The four perspectives can be defined as follows:
- Financial perspective. Here, we look at the effectiveness of the decisions made in terms of bottom-line impact to the finances of the business. This may be an impact to expenditures, revenues, or cash flow.
- Customer perspective. The customer perspective analyzes the behaviors of the customer in relation to the decisions made by the business. Customer satisfaction, customer return rate, loyalty, and net new rate are all useful metrics to be viewed here.
- Process perspective. This perspective identifies those elements that are critical to the overall quality and rate of change of quality of the business service. Here, we may look at metrics such as process sigma, rate and level of rework, and efficiency.
- Innovation & learning perspective. Lastly, this perspective attempts to quantify the level of skills associated with the workers in an environment, especially the rate of change of those skills. With this metric, we may measure skills indices, employee satisfaction and turnover, and use of and access to information.
BSM Creates Balanced Scorecard Views
The value of this kind of information is realized when looking at these views over time. Balanced scorecards provide the consumer with a look at impact based on metrics associated with each of the four perspectives. In each perspective, the consumer will find a series of metrics relating to the perspective. When the business can make decisions affecting change in the environment and immediately see real-time feedback as to the results of those changes, this model helps to provide a balanced view of their impact.
The most difficult aspect of creating balanced scorecards using other methods is in the granularity of the report information provided to its consumer. When consumers of this information are given only irregular or widely spaced reports, they will have a much more difficult time relating the specific environment changes made to the level of impact found in the result. Thus, BSM's capability to provide real-time data through its dashboards and visualizations means that this data is immediately provided to the users. Greater data resolution and report granularity means a stronger linkage can be made between change and result.
At its most basic, a "balanced scorecard view" in BSM is little more than another dashboard that is formatted per the balanced scorecard model. BSM's calculations already have the ability to generate this data. The only difference here is the formatting used to present it to the user. When other models are discovered and desired by BSM's consumers, they can be related in much the same way.
Data Collection and Connectors
Our last major topic to discuss in this chapter has to do with a technical look at the other systems and technologies that a BSM can connect to for data collection. We've already touched on this topic from a high level in previous chapters, discussing the categories of systems management and monitoring tools that plug into BSM's framework. But here we want to take a deeper dive into these specific technologies that make sense for IT.
This chapter's focus is in identifying where BSM can add benefit to the IT organization itself. That organization is ultimately charged with the management and maintenance of the computer systems under its control. But computer systems these days are many in number and reside on a heterogeneous mix of platforms, applications, and hardware. The many different kinds of technology that any business system is forced to rely upon is a big component of business system complexity. A Web-based B2B system is more than just a Web server. It's a Web server that connects to a database server, which is monitored and managed by a monitoring and management server, and all these pieces rely on a network infrastructure to communicate with each other.
None of these tools directly speak the same language. They all include exposed APIs that allow them to share data but only through certain paths and with certain formatting. As you can see, the entire system with all its intricacies is challenging to visualize.
BSM attempts to take a data-centric approach to the problem. As most applications or platforms are usually black boxes made up of proprietary code, it is sometimes not operationally feasible for BSM to tie directly into these components. In those cases, BSM must look at the communication coming out of these elements, its direction and its content, to gauge the health of the system. For others, BSM vendors have worked with application and platform vendors to develop APIs that enable deep BSM vision. In these cases, it is possible for BSM to directly monitor the health of these systems.
When looking at a BSM solution, one determination that should be made is in finding a solution that integrates with the types of technology already present (or expected to be added later) in the business system intended to be managed. For example, should a business system rely on Cisco, Oracle, and Java for its functionality, directly integrating these specific technologies with a BSM system that "speaks their language" will increase BSM's data quality. Choose wisely and review all the options before a purchase.
Data Collection Elements
In addition to the individual protocols that can be used to generically create connections within an IT infrastructure, there are several other collections where data can be gathered. These elements are represented here generically as the BSM solution chosen may have a greater or less capable function to connect to specific technologies. When considering a BSM implementation, for each of these general categories, consider the actual technology currently in place and the ability for BSM to communicate with that technology.
Messaging
Numerous messaging technologies exist, such as the ones discussed earlier, for enabling communication between the systems that make up a business service. Those messaging technologies are highly important for BSM's discovery of transaction performance and success. This is because in many ways the communication between servers is an activity that can be monitored by BSM's EUE monitoring over the network.
File Transfer
Transactions needn't involve very small data sizes. They can also be involved with the transfer of larger sets of data over the network. When file transfers are delayed in the process of a business transaction, this can impact the users' ability to complete their activity with the system. Transfer protocols such as FTP, SFTP, and SCP among others can be measured to validate their performance and success.
Infrastructure Elements
Any computing infrastructure also requires the installation of numerous infrastructure elements in order to drive the core functionality of the system. These elements such as name resolution, authentication and authorization, directory services, and management systems are all critical to the operations of the network, even if they don't directly relate to the operation of the business service.
Here the value with monitoring infrastructure elements is in understanding how their operation enables the business service to make use of the network. As an example, if Domain Name Services (DNS) is malfunctioning on a network, individual computers will not be able to locate each other. Thus, the entire system has a dependency on DNS and monitoring its health is then critical.
Databases
Databases are the ultimate storage location for all the data in a network and a business system. Thus, it is within those databases where BSM will be able to identify rates of data change and storage. Any particular business system can actually involve the use of many databases, which may or may not be aware of each other's existence. Though BSM's connection directly into databases is usually relatively limited, metadata about how databases are being used and the rate of data reads and writes is useful for viewing system health and performance.
Enterprise Monitoring Tools
We've discussed the large number of potential enterprise monitoring tools numerous times through this guide. But what is necessary to know here is that while BSM may not directly be best suited towards directly monitoring some system types, other tools can be designed with that functionality directly in mind. When this is the case, it is often of more use to connect a BSM instance to an enterprise monitoring instance rather than directly to the systems themselves. In doing this, BSM gathers its data from the enterprise monitoring systems single location.
By making the connection in this manner, the individual BSM monitoring connections are reduced in number. When monitoring client software is needed on individual servers, this also reduces the need for duplication of that software. Existing client software can be retained on servers without the need for additional BSM components.
Web and Web Tools
Web servers and the tools that assist with the management of web servers are in many deployments the front-end that points directly towards the user. Thus, web and web tools are in many ways the "bread and butter" of the BSM deployment. Although many web servers exist in today's markets, there are a relative few that are used with enterprise deployments. Ensuring that the web servers and server tools used for the business service is supported by the BSM system is critical.
Java
Java is a programming language that is relatively platform independent. Because of this, Java is an excellent tool for use in large-scale business service environments. The monitoring of Java itself is an important capability of a BSM system as the software architectures of Java allow for direct linkages for monitoring purposes. BSM can monitor the execution of Java code for performance and functionality.
Enterprise Messaging
An enterprise messaging system is a set of published standards for the transmission of data between computer systems within a network environment. There are often many applications or languages involved within an enterprise messaging system. As an example, enterprise messaging is the concept that allows a typical Java-based system to communicate agnostically with a typical database system. Enterprise messaging embodies the commonality that allows BSM to monitor the interconnections between disparate systems.
Asset Management Systems
Different from enterprise monitoring tools, asset management systems are designed to be the database of record for the inventory-able items that make up an environment. That inventory can be comprised of hardware elements as well as software elements like applications and operating systems. Because of this widespread reach of asset management systems, a BSM connection can assist with the automated generation of the service model as well as its maintenance over time.
Like enterprise monitoring tools, asset management systems may also involve client-based software as well. So the connection of BSM to the asset management system rather than a direct connection to individual services also reduces the number of BSM connections to manage.
Configuration Management Databases
A Configuration Management Database (CMDB) is an ITIL construct that encapsulates the idea of a centralized database within which all IT systems management information is stored. All CMDBs are vendor-specific, but all are intended to be a single-instance location in which data involved with the configuration of systems is located. This database is then used for change control, management of configurations, and configuration shift over time as well as reporting and compliance. As the structure of and interfaces to any CMDB is vendor-specific, a BSM system will require the vendor-supported tools with which to interface with that database.
Network Management Systems
Lastly are the network management systems in an environment. These systems are focused towards the inventory, management, configuration control, and monitoring of network devices. Unlike enterprise monitoring and asset management systems, network management systems usually also include the ability to monitor the network itself for failure and performance metrics. Thus, connecting BSM into these sorts of systems can drive network performance data directly into the service model without needing additional direct monitoring by the BSM system itself.
Proving IT Value with BSM
With this chapter, we've concluded our discussion on the value that an organization can stand to gain through the implementation of a BSM system. Starting with Chapter 6 and continuing through Chapter 7 into this chapter, we've discussed at length the various places in which an organization can benefit. We've talked about process improvements, improvements to quality of data and ability to act upon that meaningful information, and an overall reduction in operational expenditures an organization can expect.
That being said, we're also nearing the conclusion of this guide itself. Our next chapter takes what we've learned so far in terms of value and focuses it onto process improvement itself. BSM provides a tool to bring structure and a business focus to IT operations. When business and IT leaders can then visually see the functioning of their business service, they have an enhanced toolset for enacting change upon that service. Chapter 9 will go into detail about two industry best practices that BSM can use to facilitate those process improvements—the IT Information Library (ITIL) and Six Sigma. We'll do a little education on the frameworks and talk about the power of combining BSM with ITIL and Six Sigma.