How Business Intelligence Happens
How, exactly, do you "get" a business intelligence (BI) system into your organization? BI hasn't traditionally been something you just install onto a server or client computer, so it's important to understand the process, tools, and techniques that are involved in implementing and creating it. Some of these may, in fact, be major reasons why your midsize company has avoided BI in the past—making it even more important to understand not only the technologies, tools, and techniques but also how they've evolved in recent years to meet the needs of companies other than giant enterprises.
In this chapter, I'll explain the basic processes by which BI is introduced into an environment. I'll also look at some of the reasons BI is traditionally a time‐consuming and expensive proposition for most companies, and set up some of the ways in which you can implement BI more easily and for less money. Think of this chapter as the "BI life cycle"—a look into what BI actually looks like inside an organization like yours.
Assembling Your Business Data
BI is, first and foremost, all about data. The ultimate purpose of BI is to bring together data from many different sources so that you can start making connections, finding patterns, and spotting trends that wouldn't be apparent otherwise. That means the first step in implementing BI is deciding what business data you'll need to assemble, and figuring out how to get it all into one place. The actual technologies for doing so are less important right now; we're concerned with the different kinds of data that drive your business and the ways in which that data is currently stored and used. That information will help us decide which techniques you should use to pull that data into a BI platform.
I'm deliberately avoiding the term "data warehouse" for a couple of pages; although it's likely that your BI effort will involve some kind of data warehouse or data mart, that's not important at the moment. Right now, we're taking a step back from the deeper levels of BI technology and thinking about what your data currently looks like, and what you need your data to look like in order to use it within a BI implementation.
Right now, the majority of the data in your organization probably lives inside transactional databases. That is, your data lives in the systems that handle your business' day‐to‐day operations—customer ordering systems, invoicing systems, financial systems, and so on. That information might physically live in something like Microsoft SQL Server, or Oracle, or IBM DB2, or some other relational database management system. You may well have data living in smaller databases such as Microsoft Access or even Microsoft Excel spreadsheets. Some of your data may be in proprietary databases, like a QuickBooks file, or in a database used by midsize business software like Microsoft Dynamics ERP. These are called source systems or systems of record.
BI doesn't change that. Your day‐to‐day data will continue to live wherever it lives now, driving business applications, line‐of‐business software, and the other systems that make your business work. What BI wants to do is look at that data, possibly copy that data to different locations and in different forms, and to analyze that data.
Direct Data Mapping
Direct data mapping allows a BI system to connect to your business data in its current location. That is, rather than copying your data somewhere else (like into a data warehouse), the BI system simply connects to the data whenever it needs to use it. The advantage of doing so is that your minute‐to‐minute changes can be immediately viewed and used within the BI system; a disadvantage is that—depending upon how your BI system is built and used—you can place a significant performance burden on your live production systems, something that you'll typically want to avoid.
The mapping part of this refers to the fact that BI systems—as discussed in the previous chapter—typically organize data differently than a transactional system does. BI systems use data structures that are optimized for fast querying of data, whereas transactional systems often try to strike a balance between querying data and adding new data. In addition, transactional systems rarely execute the kind of complex, interrelated queries that a BI system uses.
Interestingly, data mapping almost always comes into play with a BI system—even if you don't want to allow your BI system to query data directly on‐demand from transactional systems. Sometimes, you might prefer to copy relevant data from your transactional systems into a dedicated BI data store; when you do so, you'll still need a data map that helps the BI system properly query and re‐organize the data for use within the BI solution.
Data mapping is the process of designating the data that will be utilized in the BI system, whether that data is accessed directly where it sits or copied into a different data store for BI purposes. Data mapping designates not only that data that will be used but also—to a degree—how the data will be restructured into the form used by the BI system.
Data Loading
Data loading is used when you don't want a BI system to directly access production data while users are trying to enter orders, find inventory, and balance accounts. Utilizing a data map that is either manually created or, in some cases, generated automatically by software tools, data‐loading utilities copy data out of your transactional systems, transform or rearrange the data into the structure required by the BI system, and add the data to the BI system.
In the BI world, data loading is often referred to as Extract, Transform, and Load, or ETL, which nicely describes exactly what happens: Data is extracted from one database, transformed into a different structure, and loaded into the BI system. Some BI systems may be pre‐programmed with data maps for commonly‐used business software, including Enterprise Resource Planning (ERP) solutions or other financial software; most BI systems also allow custom data loading from whatever databases you happen to have in your environment.
The transform aspect of ETL is what helps make BI so useful. Because different databases all use different structures and conventions, connecting data from different places can be very difficult. Transforming the data helps standardize it. For example, a transform process might:
- Translate abbreviations, like the names of states, into their full names
- Select only certain pieces of data that will be relevant to the BI system
- Cleanse data, such as running customer addresses through an address verification system or formatting all product ID numbers to a standardized format
- Aggregate data, such as calculating the total for custom orders, even though your transactional system only stores line‐item amounts
- Filter data, eliminating redundancies or unwanted data
- Joining data from multiple sources, such as looking up product names rather than storing less human‐friendly product ID numbers
- Validating data, ensuring that the data used for BI purposes is correct, valid, or up to date
- Correlating data from different systems—matching the data from your order entry system to the data in your inventory system to the data in your shipping system to the data in your customer relationship management (CRM) system
Data loading is often accomplished during off hours, when any burden it places on your production systems will be less noticeable to your users. This means that your BI system won't have up‐to‐the‐minute data—but in most situations, that's okay; BI systems are all about working with longer‐term trends and patterns, and less about working with up‐tothe‐second data. However, if your situation requires that your BI system work with some kinds of real‐time data, direct data mapping can be used in conjunction with data loading to provide a hybrid model that gets you what you need, when you need it.
Data Marts and Data Warehouses
As discussed in the previous chapter, data warehouses are typically where a BI system stores its data—after loading that data from your production, transactional systems. To quickly review, a data mart commonly holds data related to a portion of your business, such as departmental data. A data mart can't help make broad decisions that affect the entire company, but it can be used to help make decisions within the portion of the company that it serves. A data warehouse contains standardized, consistent, cleansed data from the entire company (or from most of it, at least), and is used to analyze patterns and trends from across the company.
For example, a data mart might help your CFO understand the relationship between salary costs and product sales, and make "what if" decisions to help predict future salary expenses in various sales scenarios. A larger data warehouse, in contrast, might help tie in information on your marketing and advertising efforts, helping the CFO predict changes in salary costs based on different advertising efforts or marketing campaigns—as those things presumably affect product sales.
Some data warehouses are built from a collection of data marts (called a bottomup approach); other experts prefer to build the larger data warehouse first, then break it down into departmental data marts as needed (the topdown approach). There are strong opinions held by different experts for both techniques, and which approach to take is often one of the first tough decisions that large companies face when contemplating a BI implementation.
TopDown, BottomUp… Help!
Pick up a good book on data warehouse design and you may quickly come to the decision that BI isn't right for your midsize company. Design philosophies are just the beginning of the difficult decisions it seems you'll have to somehow make.
But that situation is actually true for most business decisions. Will your company operate on cash basis or accrual? How will you structure your financial ledgers and accounts? How will you build and monitor a sales pipeline?
Giant companies are often forced to confront these decisions, spend time educating themselves, and make a decision. The technology solutions sold to large companies must often be customized to fit the company's decisions, which can be expensive and time consuming.
Midsize businesses, however, often take a "commonly accepted" approach. They purchase an off‐the‐shelf accounting, ERP, or CRM system, then use it however it was designed to be used. In a way, they let the technology make the decision for them, because, in most cases, the technology was written to model the most common, "best practices," and "generally accepted" way of doing things. In this way, midsize businesses save themselves time and money.
BI should be no different. Although giant companies will still need to spend a great deal of time on design decisions and other up‐front questions, midsize businesses can often select a BI solution that was designed for midsize companies, letting the solution's designers select the most common, generally‐accepted way of doing things, then simply working within that framework rather than having to make every single design decision themselves.
In‐Memory Analytics
One of the hot new trends for BI in the past few years has been inmemory analytics. The idea here is that rather than loading all your data into a data warehouse (which is really just another kind of database that stores data on disk), you load your data into a computer's memory and work with it there—interacting with disk‐based storage very little if at all. In‐memory analytics isn't actually a new concept but the recent (and massive) drop in price of computer processors and memory has finally started to make in‐memory analytics more practical.
In‐memory analytics can help reduce or eliminate the need to transform and load data into a data warehouse—something that is often time consuming—before analyzing the data. Instead, data can be queried from production sources, "transformed" in‐memory, and analyzed directly. This is especially useful for obtaining more up‐to‐the‐minute analyses and for analyzing data in a new way that isn't provided for in a traditional data mart or data warehouse.
The in‐memory technique is important for a few reasons:
- Building a data warehouse requires technical expertise, which is also required to help tune the performance of the data warehouse. Because in‐memory analysis is ad‐hoc, less technical expertise is needed, allowing business analysts and line‐ofbusiness managers to build their own reports and dashboards.
- In‐memory analysis is faster than analysis that requires disk access simply because disks are much slower than computer memory.
- In‐memory analytics can allow more flexible analysis of the data. Data can be rapidly re‐structured in memory to answer different questions without having a team redesign the data store and re‐build the database tables to support it.
In‐memory analysis isn't a perfect solution, though, because computer memory still isn't unlimited or free. Some estimates suggest that computers being used for in‐memory analysis need to have multiple fast processors and must be able to dedicate a large portion of memory to the analysis—enough memory to hold as much as 100% of the amount of data being analyzed, depending on the exact circumstances. In‐memory compression and other data‐handling techniques can reduce that memory requirement in some cases; some vendors cite a 1‐to‐10 data‐volume ratio, meaning you'd only need enough memory to hold about 10% of the data you plan to analyze. Midsize businesses—which often deal with less sheer volume of data than huge enterprises—may find that in‐memory analytics is an affordable and practical technique for their BI needs.
InMemory Advantages
Business users hate waiting for answers. Tell a manager that his reports will only come once a week or that he'll have to wait a few hours to get responses to analysis queries, and that manager will probably give up on BI. In fact, many organizations still relegate BI system use to a few trained, patient business analysts. But the power and flexibility gained from giving front‐line managers access to fast BI tools can't be ignored.
With in‐memory analytics, query time might drop from 30 minutes to a few seconds—provided you can employ the hardware needed to make it happen. Once users become accustomed to such rapid performance, they start asking the BI system more questions, getting more answers, and running the business based on facts and trends rather than on gut instinct.
In‐memory analysis can work without a data warehouse, meaning you won't need as much on‐staff technical expertise to get up and running with BI. That makes in‐memory analysis especially attractive to midsize companies whose IT staff might not have BI expertise or who simply might not have the bandwidth for a more complex BI project.
In‐memory analysis has started becoming popular not because if its advantages—after all, who wouldn't want faster answers?—but because of its feasibility. Just a few years ago, 1GB of computer memory cost over $150; today it costs less than $35 or so. A powerful analytics server with 64GB of memory might have cost $64,000, and today costs only $13,000—much more affordable. The increased power—and lower cost—of 64‐bit, multicore computer processors has helped too, as those processors can physically connect to the large amounts of memory needed to make in‐memory analytics possible.
Creating an Information‐Driven Business Culture
"Every time we raise the price of the product, we sell more copies." That's what one business executive told me, and that simple correlation drove many of the company's business decisions. Of course, correlation is not causation; the company was also adding significant new features to the product, exhibiting at more trade shows, and spending more on marketing and advertising. But that one simply factor—product price—is what drove that executive's gut decisions.
Managing by instinct is especially common in midsize companies, particularly because many executives and managers have been with the company for a long time and still feel they have a complete view into all of the company's data. But as tiny companies grow to be midsize ones, it becomes more and more difficult for a single human being to keep their fingers on every one of the company's pulses; managers stop managing based on information simply because they don't actually have all the available information. Eventually, they simply start managing on instinct—something that is unreliable, not repeatable, and generally doesn't serve midsize companies well in the long run.
After you get your data into a BI system, you have to start teaching yourself and your colleagues to use that information and to trust it. Create an information‐driven culture— rather than an instinct‐driven culture—in your midsize company. BI systems offer a number of efficient—and, frankly, sometimes cool—ways of doing so.
Skill ≠ Instinct
Not managing by instinct is not the same thing as not needing managerial skills. Good managers can still rely on their experience and their intimate knowledge of how the company works—that experience and knowledge can simply be more informed. Providing facts and information, filtered and tempered by experience and skill, is the way BI can make managers' decisions better.
Of course, I have to acknowledge that creating an information‐driven culture does not mean that experience and hands‐on management aren't useful. I've known—and in some cases worked for—too many managers that spent all day staring at spreadsheets and never tempered all that information with a hands‐on reality check. They weren't, to put it kindly, all that effective at managing. Information should contribute to the management process, not dominate it.
Reporting
Good managers love reports. Reports offer information—data points that can help direct management decisions. A BI system simply produces broader, more insightful reports than those offered by a single transactional system. An order‐entry system, for example, might tell a manager the average value of all the orders entered for a typical business day. A BI system, however, can also tell that manager the average cost to enter those orders because the BI system can draw from many other sources of data—including sources that offer salary amounts, utility bills, and much more. A BI system can also help that manager see trends in order volume based on advertising; a skilled manager backed by a good BI system will know exactly how many additional staff will be needed to handle the onslaught of customer orders that will accompany the newest upcoming television ad.
Reports from a BI system can be highly‐flexible, and even dynamic, allowing managers to use a report to ask "what‐if" questions, and make decisions based on the results. Figure 2.1 shows a typical BI report, displaying aggregate sales, sales by product category, and topselling products. This kind of summary‐level report helps managers focus their efforts, make product stocking decisions, and so on. A dynamic version of this report might be clickable, letting managers drill down into more detailed information as needed.

Figure 2.1: A common BI report.
Some managers are skilled in using Microsoft Excel, which offers built‐in pivot table functionality and can use add‐ins to provide even more BI analytical functionality. By connecting Excel to a data warehouse or an in‐memory analytics server, as Figure 2.2 shows, managers can pivot data, build custom analyses, drill through data, and propose "what‐if" scenarios to see the results. This helps managers see the potential outcome of decisions, helping drive the decision that most benefits the company. Figure 2.2 actually shows an Excel add‐in, which is something that many BI solutions include or offer.

Figure 2.2: Connecting Excel to a data warehouse or inmemory analytics server.
The biggest challenge with a BI implementation is getting managers to use these powerful tools. Once exposed to them and shown how to utilize them, most experienced managers will never turn back.
Dashboards
The report in Figure 2.1 might be more accurately called a dashboard, which is a common feature of most BI systems. Dashboards are specialized kinds of reports that utilize graphical displays to summarize key information for at‐a‐glance consumption. Dashboards—like the dashboard in your car—help manager keep track of critical, highlevel metrics. Figure 2.3 is another dashboard example.
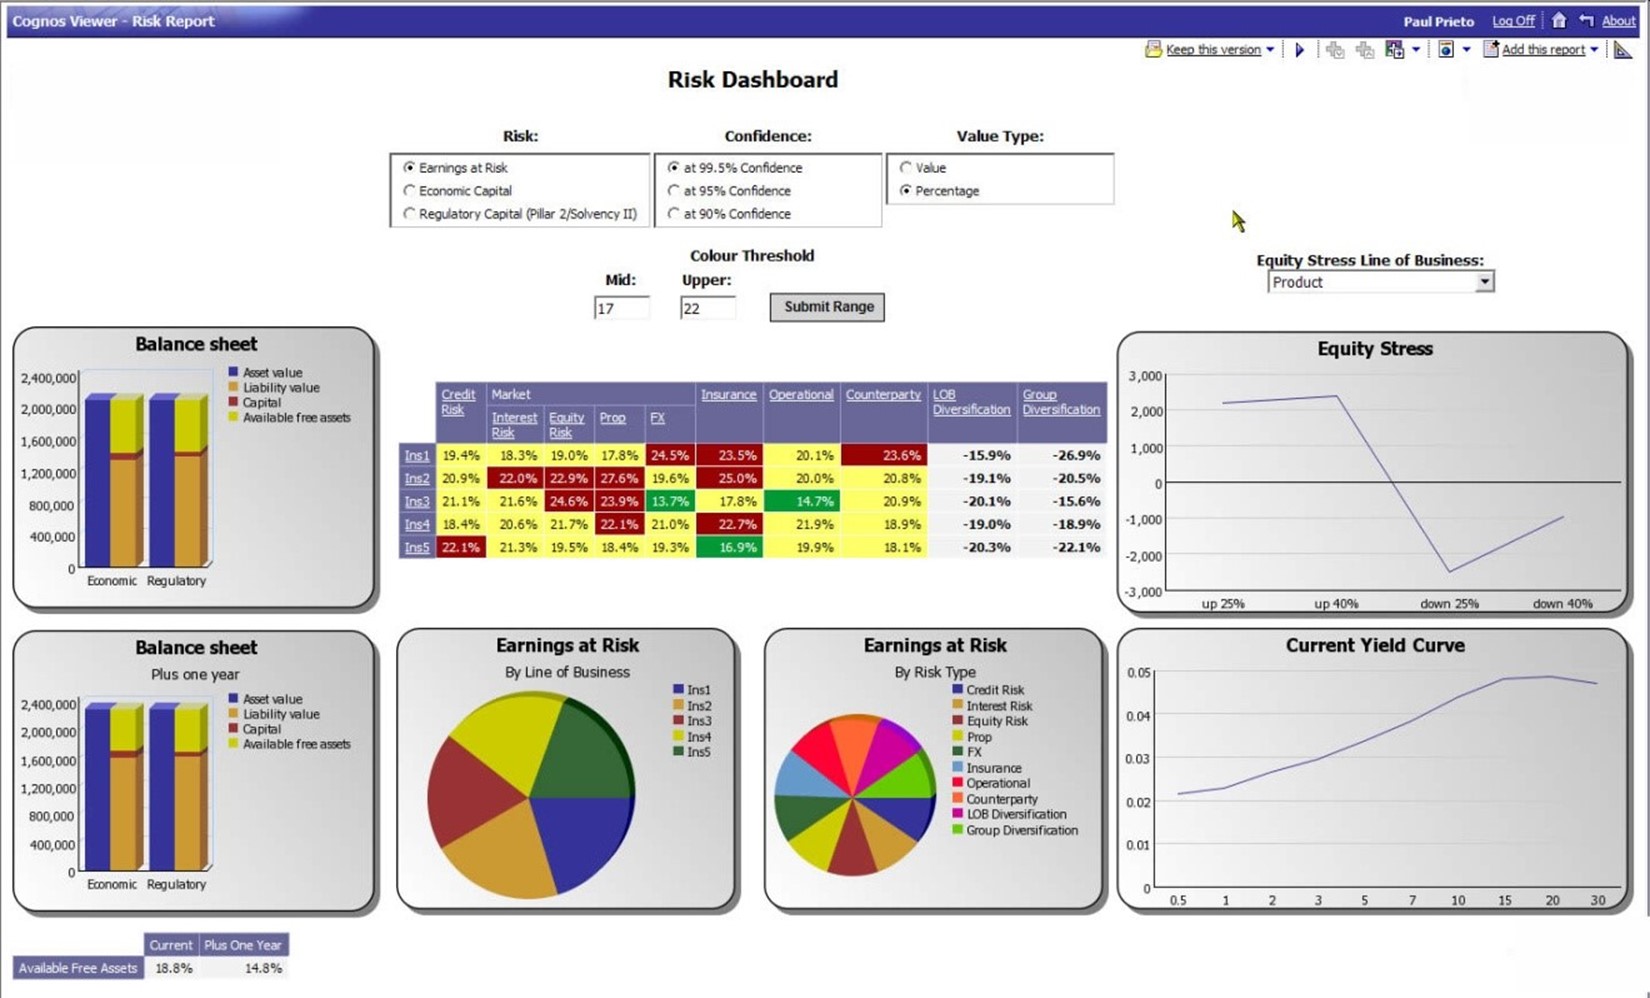
Figure 2.3: BI dashboard.
This dashboard might be ideal for executives or top‐level managers, as it helps them see the company's current balance sheet, the projected balance sheet in one year, earnings at risk by line of business and by risk type, and other high‐level metrics. Dashboards aren't designed to drive immediate decisions; like your car's "check engine" light, a dashboard indicator is intended to drive further investigation if something looks amiss.
Scorecards
Scorecards, like dashboards, are intended to give a high‐level overview of key metrics. The big difference with a scorecard is that—like the ones you remember so fondly from school—a scorecard applies an absolute grade based on relative thresholds. In other words, for each metric, the scorecard tells you if the company is doing "good," "okay," or "bad." Figure 2.4 shows an example, where color‐coded metrics help draw managers' attention to problematic areas—like sales growth, Web site visitors, and improvement suggestions, which are all red in this graphic.

Figure 2.4: Example scorecard.
The idea of a scorecard is simple: If everything is an "A" or "B," then you're basically doing well. Items with a "C" or "D" deserve additional attention and managerial effort; items with an "F" are in need of immediate and significant attention. As with a dashboard, the idea is not to drive immediate decisions but rather to help focus effort and further investigation where they are needed most urgently.
Graphics = Engaging
Humans are visual creatures. Few managers relish the thought of staring at rows and columns of numbers, trying to pick out areas that they need to focus on. Informational graphics like those in dashboards and scorecards engage our visual senses and help us quickly sort out priorities.
A typical corporate profit and loss (P&L) statement is an example of how rows and columns of numbers aren't always good at driving managerial attention. Expenses are at 10%? Okay…is that good or bad? We spent $23,000 on shipping? Great…or not?
A dashboard, however, can show a chart comparing current performance with last year's; any bar in the chart that is significantly out of whack is an immediate call for attention. A scorecard can be designed to color‐code anything that is more than 10% out of line, helping draw attention where it's needed most.
Although traditional textual reports will always have their place, one of the biggest and most immediate values a BI system can deliver is dashboards and scorecards that help managers focus their time where it is really needed.
Analyzing Business Information
Let's briefly pause and examine where we are in the BI life cycle. Figure 2.5 illustrates what we've already accomplished.

Figure 2.5: Our progress so far.
We've mapped data from live data sources throughout the organization. In some cases, our BI system will use that data directly, while in others, it will extract, transform, and load that data into the BI system—either into a data warehouse or perhaps into an in‐memory analytical structure. From there, the BI system will produce the reports, dashboards, and scorecards that we'll be using to check on our organization's health and progress, ask "what if" questions, and so forth.
The next step is to get this information into the brains of managers, analysts, and others who will use that information to help drive business decisions. Should I draw an arrow leading from the information to a person? Probably not: One thing we have to acknowledge
is that you can't push information to people; people have to voluntarily pull that information, actively examining it and using it to help inform their decisions. That's ultimately what makes a BI implementation succeed or fail: Is it used by the right individuals to inform the right decisions? Of course, you can help speed BI adoption by ensuring that your BI system provides accurate, timely information to the right people within your organization—and ensuring that it does so quickly.
Once that BI information is in the right hands, or rather heads, and they're prepared to use it, the act of analysis and decision‐driving truly begins.
Analysis and Visualization
One of the most difficult aspects of a BI system is teaching its users how to analyze data. Simply staring at a report or dashboard isn't sufficient; BI users need to know how to "slice and dice" data to find the answers to specific business questions, see patterns, spot trends, and drive decisions. This helps to uncover opportunities for new markets or efficiencies, or to explain why a particular area of business performance is good or bad (and yes—you definitely want to focus on good performance as well as bad, because the causes of good performance can often be utilized elsewhere to improve the overall business).
Most managers are actually familiar with a certain type of business modeling and analysis: spreadsheets. These are a two‐dimensional form of business modeling, often displaying metrics over time, breaking down performance by business categories, or something else. That's two dimensions: metrics and time, performance and category, and so forth. Figure 2.6 shows a common spreadsheet, displaying actual business metrics against planned metrics. Again, that's two dimensions: actual and planned.
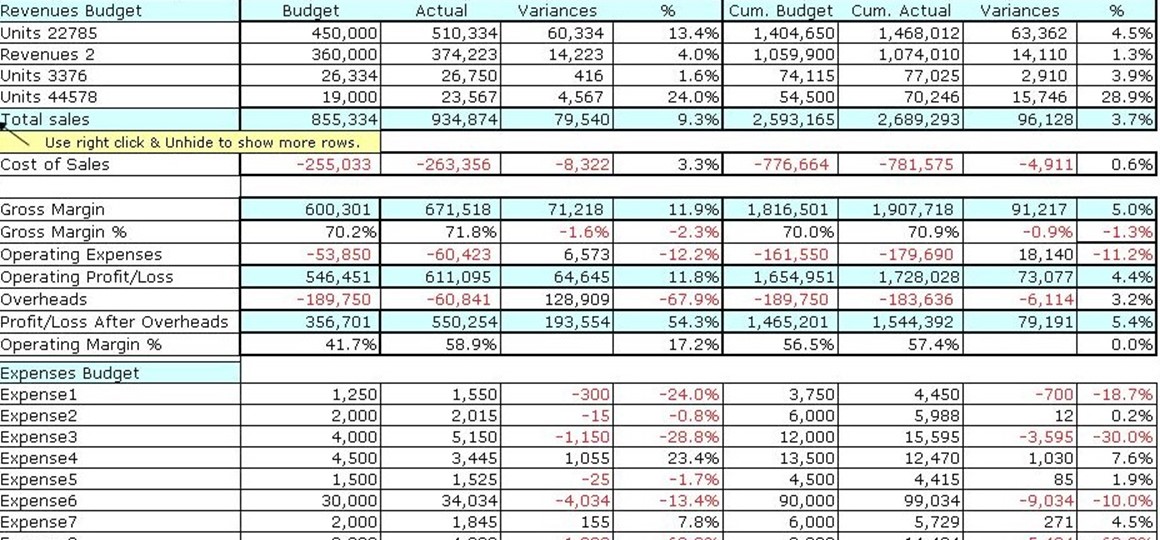
Figure 2.6: Analysis via spreadsheet.
The problem with two‐dimensional analysis is that it's far too limited. Two dimensions aren't nearly sufficient to represent the complexities of even a very small business, let alone a typical midsize business. Although spreadsheets like this are useful for quick overviews, they don't provide an easy way to drill down into the data to uncover hidden details and root causes.
By contrast, BI is built around the concept of multidimensional analysis. It can be tricky to explain and illustrate, simply because computers are inherently two‐dimensional when it comes to displaying information.
To display multi‐dimensional information requires display tricks and conventions to mimic multiple dimensions; a spreadsheet pivot table is one such convention. Figure 2.7 shows an example pivot table.
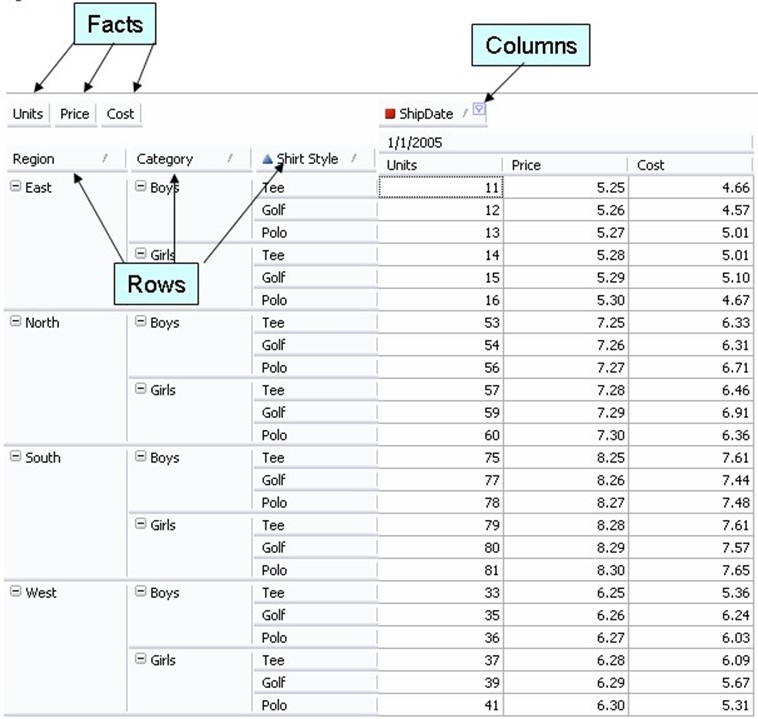
Figure 2.7: An example pivot table.
Microsoft's brand name for pivot table functionality within Microsoft Excel is "PivotTable;" the more generic "pivot table" describes this functionality in any product that offers it.
Pivot tables typically consist of multiple facts, which are added by the user. Here, the facts are Units, Price, and Cost—numeric dimensions. The columns and rows can be any kind of dimension: Row dimensions create a row for every unique value, while Columns create a column for every combination of column fields and facts. A simple pivot table like the one in Figure 2.7 can help spot critical business problems, such as poor unit sales in a given region or higher unit costs in a given category in a given region. It's those multiple dimensions—regions, categories, and styles—that help bring more information into play.
But pivot tables can reveal much more. In Figure 2.8, I've added a total row—shown in light yellow—to help reveal aggregate information.

Figure 2.8: Adding aggregates to pivot tables.
The ability to dynamically add totals and other aggregates helps users roll up information to see the results from a given dimension or set of dimensions. Here, both "boys" and "girls" categories are subtotaled, and each region is totaled as well. Pivot tables are designed to work dynamically, allowing the user to explore and visualize data in whatever way they want. For example, I can remove the "Category" dimension, and the pivot table recalculates, as shown in Figure 2.9.
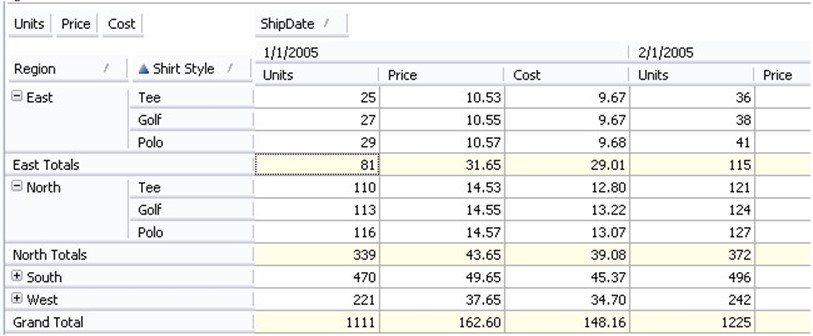
Figure 2.9: Rolling up data in pivot tables.
I've simplified my view of the data to see only styles, regardless of category. I may have decided that categories weren't a factor in whatever I was analyzing, and by eliminating it, I can view my data and aggregations based on other factors—simply style and region, in this case. This view reveals that the East region sells through significantly fewer units than the North region, a fact that was available to me before but may have been less obvious because it was buried in with so many other numbers.
But here's the problem: Although pivot tables can be useful for users who are already comfortable in Excel, you shouldn't limit this type of BI to just those users. Also, digging in and discovering facts and information solely using spreadsheets can become pretty overwhelming. That's why any good midsize BI solution may support pivot table functionality, but it will definitely support more powerful in‐memory analytics, and offer much friendlier and more intuitive user interfaces. These UIs are often presented in a Web browser application, for example. Figure 2.10 shows how a Web interface, powered by a back‐end analytics engine, can present data in simpler forms, like a bar chart.

Figure 2.10: Displaying data in chart form.
This chart would be based on live or recently‐collected data that was analyzed in memory, meaning it's up to date. But the powerful part about this kind of business intelligence is that this chart isn't static. Wondering why golf equipment's margins are the way they are? Just click on that portion of the chart. The analytics engine goes to work, pulling together the supporting data that resulted in the first chart and displaying a second "drill‐down" chart, shown in Figure 2.11, that shows more detail.
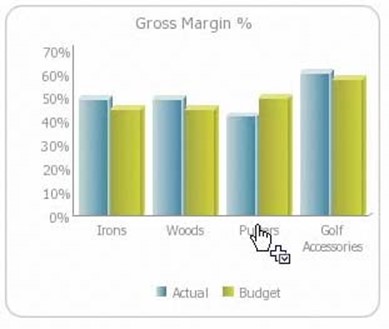
Figure 2.11: Drilldown chart.
Now we can see that putters, as a category, is dragging down margins on golf equipment a bit. Further clicks would drill down even deeper, revealing individual products, manufacturers, and so on, letting us quickly find the answer we were looking for.
But an in‐memory analytics engine can do much more. Suppose the first chart, which breaks down sales by product category, isn't answering your questions. Instead, you want to see product sales grouped by store location, or by product vendor, or some other grouping. No problem: Because the analytics are being performed in‐memory, you can rearrange and re‐group however you like, letting you look at your data in ways that make sense to you, and helping you discover important new relationships and facts.
As you become more aggressive about analyzing your business' data, you'll find that the best suite of tools includes features like pivot tables in a spreadsheet, analytical add‐ins to applications like Excel, and Web‐based front‐ends to powerful in‐memory analytics engines. With this combination of tools, more users and managers will have access to better data more quickly. They'll be able to dynamically change what they're looking at to answer exactly the right questions.
Uncovering Root Causes Behind Data
You glance at a dashboard display and see that sales aren't where they should be—what do you do? As I've described earlier, a dashboard and other BI "summary" displays should drive investigation, not immediate decision; your response to something alarming—or, for that matter, gratifying—in a dashboard display should be to dig into the root cause, looking either for a problem that needs to be solved or something beneficial that may need to be examined and exploited.
Because BI systems combine data from all over the organization, they excel at providing the details behind the dashboard—for users who know what to ask and how to ask it. In the BI world, asking a question of the system is called a query, and the results are typically a report, graph, or other data visualization. The benefit of a BI system is that, unlike more traditional reporting systems built atop transactional databases, BI systems can respond quickly with answers—giving users more opportunity to refine, revise, and re‐submit their query to find the real answers to their questions.
BI systems typically offer users a variety of ways to submit queries and receive results.
Query options may include:
- Natural‐language queries. These systems allow users to ask plain‐English questions like, "How do sales in the East and North regions compare for last quarter?" The system parses the question and matches key words to data facts, and produces the appropriate report.
- Graphical query builders. These systems use a drag‐and‐drop interface to present users with available data facts, allowing users to select the facts that interest them, indicate filter criteria, and so forth.
- Query languages. These systems accept queries written in a specific query language, which is often a variant of the industry‐standard SQL language. Although this option requires a more technically‐proficient user, it does offer a high level of flexibility.
BI systems commonly allow users to save their queries; this makes them available not only for easier querying in the future but also to other, less‐skilled users.
And because a good BI system will also make data available through intuitive Web interfaces, your users might not need any particular querying skills in order to drill down, rearrange, and re‐group data, and find the answers they need.
The Importance of Modeling the Business
Of course, a BI system can really only work effectively if it accurately models your business. For example, if your business' success focuses on delivering services in a specific period of time, but your BI system's models are focused on facts such as revenue and costs, your BI system won't be as effective in helping you uncover root causes and find new efficiencies and opportunities. Modeling—one of the first steps in a BI implementation, and closely related to data mapping—ensures that your BI system understands what your business looks like, how it works, and how your various pieces of data fit together.
Making Decisions and Taking Action—The Planning Connection
Let's say you've got a great BI system. It contains data from all over your organization, and you've become skilled in submitting questions and reviewing the results. Your decisions are being driven more and more by the information you uncover through your BI system. What next?
The last connection in a BI system is making those decisions a reality. Take a look at Figure
2.12, which illustrates the true purpose of a BI system.
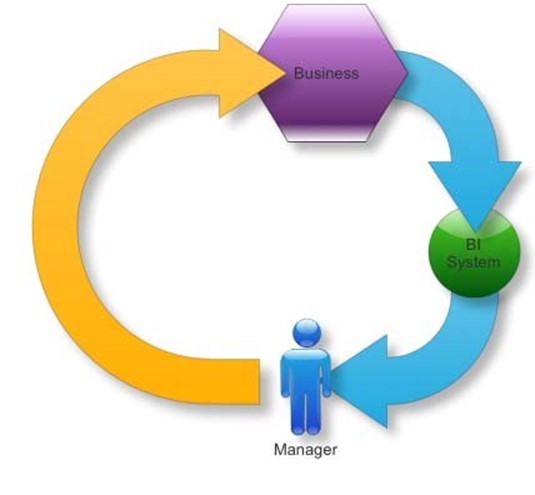
Figure 2.12: The purpose of BI.
The goal of BI is to draw data from your business and use it to inform managers. Those managers' decisions then influence the business, hopefully changing it for the better in some fashion. That change affects the data coming out of the business, which goes into the BI system to influence the next round of decisions.
So the missing piece here is this: How do managers' decisions get into the business? In most midsize companies, it's not as simple as managers deciding to run a new ad campaign to boost sales; decisions have consequences such as costs and manpower that have to be accounted for. That means managers' decisions can't always be implemented instantly; instead, they have to impact the company's planning process.
Planning: Aligning Resources to Opportunities
Most companies have some kind of planning system and process in place. In many midsize companies, it's simply a collection of spreadsheets—sales forecasts, budgets, capital planning, and so forth. Business managers are constantly looking for better data: What drives the business? Where is the business trending? In many situations, those managers turn to spreadsheets—often hundreds of them, often individually managed by different people throughout the company.
The problem with getting information that way is that it takes a tremendous manual effort to keep it all updated. In addition, learning anything that requires aggregating separate spreadsheets is really difficult. What's nice about those spreadsheets, however, is that you can change them: plug different values into different cells, then see what happens. What if we assume a higher sales volume—will we need more staffing budget?
Today's businesses are also becoming more dynamic, and that demands a more interconnected, dynamic planning and forecasting system. That's where your BI system can step in. Figure 2.13 illustrates how the many portions of your company are connected; shouldn't your planning data be just as interconnected?
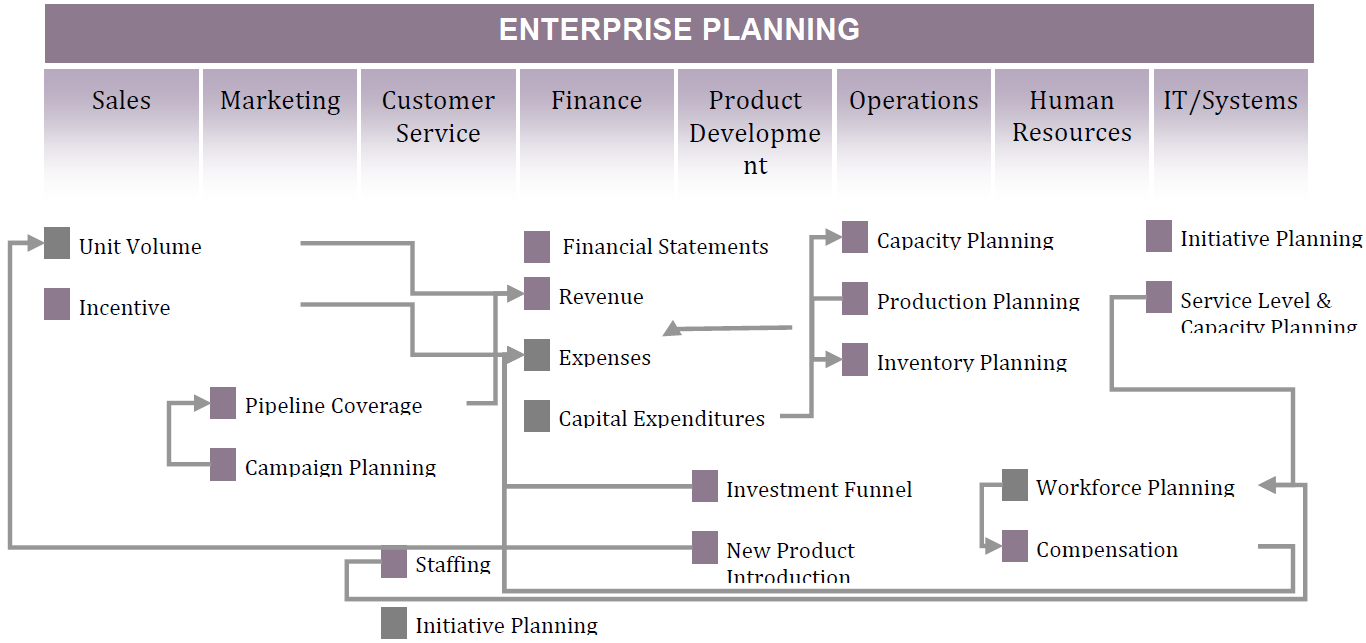
Figure 2.13: Enterprise planning understands the interconnectedness of your company's pieces.
A simple BI system consisting of a data warehouse can provide facts, but it's essentially read‐only. Sure, you can pull some of that data into a spreadsheet—perhaps using a pivot table or an add‐in of some kind—but then you're right back to dealing with individual spreadsheets. By most definitions, a data warehouse is always read‐only: It's a specialpurpose copy of your data.
More powerful BI systems offer true Online Analytical Processing, or OLAP, including writeback capabilities. With write‐back, you're actually able to plug new numbers and facts into the analysis engine. You're not modifying any of your historical data, but you are modifying the way the numbers connect to one another. You're modifying assumptions, and asking "what if," with the power of the entire analytics engine behind you.
Think about how this works. A BI system can connect all of the data in your company. You can dynamically re‐group and re‐arrange information to answer different questions, all on the fly. That's great for answering questions about the past—what has already happened. By being able to reach into the analytics system and make changes, you can start figuring out what might happen in the future. You can see sales trends change, see how budgets might be affected, see how you might change your hiring patterns, and so on. You take the latest beliefs, forecasts, and commitments from business managers, and see how they'll affect things like inventory acquisition or customer service volume or production capacity. That lets you make planning changes. Suddenly you're no longer reacting to your business—you're driving it.
What if you write numbers into the OLAP system that predict a downward drift in revenue—something many companies have been facing in recent years? Rather than being caught off‐guard and having to merely react to changing markets, you can be in front of the problem, recalibrating expenses and other expenditures so that your company can remain agile and profitable even during a downward swing. It's all based on the capability of your BI analysis engine to take new assumptions, crunch them into your companywide data, and show you what the result looks like.
One of the worst times at most any company is Budget Time, with Quarterly Forecast Time coming in a close second‐worst. Sometimes it feels like everyone is just pulling numbers out of thin air, sticking them in spreadsheets, and then hoping for the best. Part of the problem is that everyone's trying to pull data from a dozen different places. They're trying to roll up that data to a profit and loss (P&L) statement level, to create projections on things like cash flow and expenses. Because of the difficulty in doing this manually, a lot of companies don't do it very often—meaning they're running without forecasts, without real plans. With a write‐back OLAP system, however, all that changes. You're no longer working with decoupled high‐level goals and low‐level capabilities. Want to see what it would take to double your revenue? Plug the number in, and let the OLAP system show you what it would take to reach that number. Want to see what effect a downsizing would have on the bottom line? Plug the number in, and look at the graphs, charts, and reports.
As Figure 2.14 shows, this is where BI really closes the loop for a company. BI is more than just a data warehouse that quickly serves up facts about what has happened; a good analysis system can also tell you what will happen, when you plug in estimates, forecasts, and what‐if scenarios.
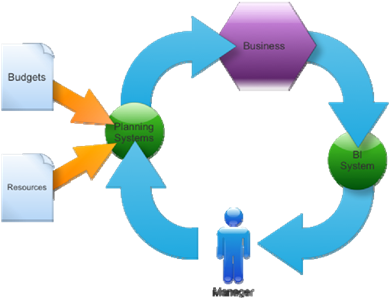
Figure 2.14: Closing the BI loop.
Write‐back isn't a capability supported by all BI systems; if you feel this is an important feature for your business, be sure you take it into account when evaluating different BI solutions.
Closing the loop in this fashion helps create a more automated link between BI, management, and the company's day‐to‐day operations.
Coming Up Next…
There's a real problem with BI, especially as it relates to midsize companies. That problem is misinformation. There are a tremendous number of myths out there that tell you what you can and can't do with BI in a midsize company, and most of those myths are—at best— based on outdated information. In the next chapter, I'll outline the four biggest myths that drive midsize businesses away from BI, or lead them down an implementation path that is unnecessarily expensive and time‐consuming. We'll debunk those myths and set the record straight.