IT Service Management Evolution
"Beep, beep."
"Oh, not again," thinks First Class Glass COO Dan Bishop as he rolls over in bed for what seems like the third time this month. Picking up his mobile device he reads the message on its screen, "Another one? Why do these things always seem to happen in the middle of the night?"
'DEN-RTR-02B-H, Failed Ping Response, 10/13, 4:23a, Expected down. TKT 104328 assigned to NET_OPS.'
"What the heck is a DEN RTR," he thinks as he starts to dial up his IT Director John Brown, "and why do I care if it failed a ping response? These sorts of middle-of-the-night mobile device beeps must be commonplace for the IT guys. But I'm too busy and too near retirement to get blasted out of bed like this once a week. How do these guys do this all the time?"
John answers the phone with an equally bleary voice. "What's a D-E-N-R-T-R and what happens when it fails a ping response," asks Dan to his IT top gun.
John responds groggily, "G'mornin', Dan. That means one of our backup routers in the customer DMZ couldn't be reached by the monitoring system. Lack of a ping response tells us that it's not talking on the network."
"Is this bad?"
"Not really," John explains, "We've got another router on that network that load balances with the router that went down. When either one of them goes down, the other has enough bandwidth to handle the load until we get it back up. It's nothing to really worry about. One of my guys will fix it when they get in later this morning. That router's been giving us trouble anyway. It's probably time to replace it with a newer model."
"'Nothing to worry about, eh?' That's what you said last month when we lost that 'minor IT system.'" Dan thinks to himself as he hangs up the phone and tries to catch one more hour of sleep.
You see, a little over a month ago that minor system's outage caused FCG a six-figure cost overrun in their accounting department. And since then that's all that's been on Dan's mind. Outages. All the time, it seems.
Because of that outage and IT's mischaracterization of it, Dan has asked to have his mobile device paged by the notification system whenever anything shows a problem. But in asking he never realized just how often things went down. What's worse is that they always seem to go down in the middle of the night, and always right before a big customer presentation the next day. He's beginning to think that asking for this level of detail was a mistake, but he doesn't want to back down now.
You see, it was Dan's job on the line when he got called into the CEO's office to explain the situation and the budgetary hit last month. He doesn't want to go through that experience again. "He needs a new router, then?" he thinks as he falls back asleep, "We'll discuss that in the morning."
Maturity Impacts IT Goals
In our last chapter, we talked about the need for alignment between IT and the business. We discussed how IT organizations everywhere are going through a maturation process. Through that process, they are coming to understand their priorities and responsibilities in the business. Through maturity and over time, IT moves away from a reactive mode of operations toward one in which they understand their coupling with business financials and operational processes.
In this chapter, we'll move away from the cultural aspects of IT's maturity and into the technical concepts associated with IT's monitoring of its systems. Here we'll be discussing the role of IT services and the management of those services. As IT becomes more mature, it experiences an evolution in the way it evaluates the management and monitoring of their business systems. Along with that, it begins to develop the linkages between traditional Network & Systems Management and the Process Management that drives the rest of the business.
As you can see from our story earlier, FCG is still going through that maturity process. Early attempts at aligning IT with the needs of FCG's business failed, and so a single IT system's outage is causing pain both in terms of dollars and in loss of sleep for at least one executive. What you'll learn in this chapter is that this begs the following questions Does Dan really need to get paged out of his sleep once a week for every router's or server's missed ping packet? Or is there a more digestible way for him to keep up with the operations of the network on which his business runs?
Among others, it is these questions that this chapter, this guide, and indeed the tenets of BSM attempt to answer. Dan's job is to understand and act based on the needs of FCG's customers.
His job is not to manage the status of his company's network devices and applications. But as COO, he does have responsibility for that network's operations. Properly combining the requirements of his responsibilities with the needs of his job is one of the goals BSM attempts to fulfill.
In order to do so, we'll start this chapter by defining an IT Service and continue by discussing how that definition has evolved over the years from its beginnings in terms of strict network availability to today's understanding of BSM service quality.
What Is an IT Service?
According to the IT Information Library (ITIL), an IT Service is defined as:
A service provided to one or more customers by an IT service provider. An IT service is based on the use of information technology and supports the customer's business processes. An IT service is made up from a combination of people, processes and technology and should be defined in a service level agreement.
Taking this one step further, we should also define a business service. A business service is an IT service that directly supports a business process, as opposed to an infrastructure service, which is used internally by the IT service provider. The term is also used to mean a service that is delivered to business customers by business units. Successful delivery of business services often depends on one or more IT services.
Deconstructing this statement in relation to traditional IT managed devices and applications, an IT Service can encapsulate the processing of data; the transmission of that data through processing elements; the visualization, manipulation, and administration of that data through users and administrators; and the data itself.
So in layman's terms, an IT Service is something ultimately recognizable by that service's consumer. If the consumer can "see the forest for the trees" associated with their description of the service, then we have done a good job of creating the service as categorizable.
There is one major difference here between the ITIL definition and how a service is internally defined by many IT organizations. Those organizations not at higher levels of maturity often leave off the most important component of the definition: The business and workflow processes that enable the successful use and management of that data as it proceeds from creator to consumer. In effect, what many lack is the reason for the data's existence.

Figure 3.1: Numerous CIs make up an IT Service. Many IT organizations lack the organizational maturity to include business process as a manageable CI.
This removal of business relevance from service definitions, especially when dealing with the monitoring needs of an organization, leaves an incomplete picture. Lacking those processes and procedures leads to a techno-centric definition of IT Services which inhibits their alignment with the business processes that rely on them.
We've discussed at length the need for business-centric definitions in any mature understanding of a business service. Throughout the rest of this chapter, we'll justify this need by filling in the historical gaps of how that data's definition has evolved over time.
Service Management
Identifying services is one thing, but ultimately managing those services is yet another. One definition of IT Service Management is the implementation of a strategy that defines, controls, maintains, and enhances the IT Services for the enterprise. It embodies people, processes, and technology in order to provide quality of service (QoS) for business objectives and operational goals.
As we've discussed in Chapter 1, one of the major components of either a BSM installation or really any Network & Systems Management (NSM) rollout is the identification, classification, and granularization of IT Services into their atomic components. Removing BSM completely from the picture, think about the steps you take in setting up monitoring within a traditional NSM environment:
- Endpoint Identification—The first phase is to identify the manageable endpoints within a network environment. Those endpoints may be network devices, individual servers and applications, managed environmental control components, and intra-service triggers of interest.
- Element Classification—Once an inventory of manageable endpoints is identified, those elements are classified into various categories. Often, this classification is based on endpoint type and again based on the level of notification desired for that endpoint.
- Notification—Once identified and grouped, those groups are assigned notification rules based on the need for IT to recognize state changes for elements within the group. Element groups of high criticality are given more stringent notification rules than those of lesser impact on operations.
- Iterative Granularization—After notification rules are set into place, a follow-on improvement period for those rules and classifications is completed. Typically, this improvement phase adds alerts and notifications that were omitted in the first phase, but later found to be critical.
- Remediation Assignment—Once the model becomes relatively static and the comfort level of the organization increases, automatic remediation actions can be assigned to regular events. Obviously the addition of automatic remediation components has an element of risk, so rarely does this step in the process see use in full production.
This process relates to a traditional NSM's incorporation of IT Service Management. What we will find as we go through this chapter and into the next one is that BSM augments these steps with a few additional ones—namely the steps associated with Service Quality Assignment and Business Relevance and Metric Linkage.
The Timeline of Management and Monitoring
Let's take a few steps back from our definition of IT Service Monitoring and take a hard look at how this process has come into being. Doing so will help us understand the relevance of BSM's tenet of service quality and the metrics that align with that tenet. Once we understand how management and monitoring has evolved over the years—growing ever closer towards alignment with the business—we will better recognize its drive towards a focus on value.
Since the beginning of modern computing, there has been an ever-growing need for systems management and monitoring. As the number of computers that make up a network has increased, the number of configurations and manageable endpoints has geometrically increased as well. Adding even a few more systems into a network means adding dozens or hundreds of additional management touch points to that network environment.
Over time, the process of managing those touch points has evolved, starting with the early attempts at network management, through proprietary agent-based tools, resting now for many organizations with a new focus on agentless management and end user experience monitoring. What we anticipate to see in the future as we continue down this timeline is a refocusing on value in the near-term future by organizations that have progressed up the maturity curve. Let's take a deep look at each of these steps in the timeline to help us understand how yesterday's technology drives the needs of today. 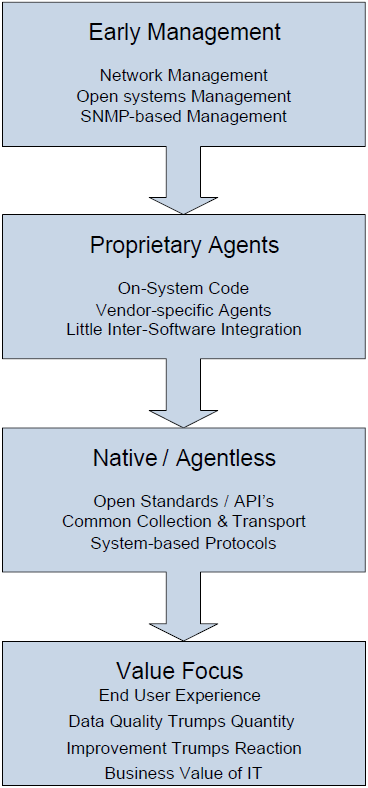
Figure 3.2: Four discrete timeframes in the evolution of systems management and monitoring.
Early Management
In the beginning, there was the Simple Network Management Protocol. SNMP was originally a network-focused protocol designed to provide a common framework for devices to relate state changes to a centralized Network Management System (NMS). SNMP describes both the protocol that transports state change information around the network and the framework that defines each network device's remote monitoring and configuration capabilities.
SNMP's original goal was to provide the administrator information about the status of network devices. Originally relegated to those devices only, the protocol and central NMS could notify an administrator when a network device such as a router, switch, or firewall dropped off the network, began losing an excess of packets, or otherwise entered into an undesired state. Early NMS' were, and in many cases continue to be, completely device-centric. Typical heads-up interfaces display network maps with stoplight charts displaying the status and health of network devices.
As time progressed, additional components were added to SNMP to manage elements other than network devices. SNMP Management Information Bases (MIBs) were extended into the server and application space as well as environmental control devices within the data center. SNMP's device-agnostic architecture meant that virtually any device that retains on-board state information had the ability to push that information to a central NMS through the SNMP transport protocol. In fact, SNMP's capabilities are and were so generically designed that it continues to this day as a major tool in network management for many devices across the network.
Proprietary Agents
Over time, some of SNMP's weaknesses eventually came to light as administrators attempted to use it as a tool for managing configuration change on the part of network devices. Whereas SNMP is an excellent tool for reading device information, using it as a tool for writing a configuration was found to have security implications. Also, while many devices eventually grew the capabilities of pushing information through SNMP, few adapted that ability for updating on-board information. Moreover, even as servers and applications started down the road of providing SNMP-capable interfaces for monitoring for state change, not all server and application functionality was exposed.
In this vacuum of remote management capabilities came forward a set of proprietary software solutions that could provide the necessary management. Although SNMP was embraced by virtually all vendors of network devices, those who built systems and applications found themselves moving towards other third-party tools along with their on-board agents to provide better access to system and application information.
It's important for us to stop here to talk a little about those early attempts at systems and application management. The early attempts, with many still being used today, utilized proprietary agents that are installed directly onto the system of management. These "proprietary agents" were pieces of code that needed to be installed onto every system under management. The agent would regularly inventory the system for configuration and state information, wrap the result into a transmittable package, and send that package across the network to the NMS. The use of installable agents for systems management had both its pros and cons (see Table 3.1).
Pros | Cons |
Remote management capabilities | Time delay associated with agent poll cycle |
Little network impact | Requires network support of agent protocol |
Rich capability support | High cost of agent management |
New capabilities easily added to agents | New capabilities = agent upgrade |
Table 3.1: The pros and cons of proprietary agent-based systems management and monitoring.
It should be noted here that agent-based utilities are not necessarily a bad thing. In fact, many modern management and monitoring tools continue to make excellent use of agents as a system component. Agent-based utilities have the ability to provide more management capabilities to the administrator because additional capabilities can always be coded into the agent. And, all things being equal, agent updates are often much easier than system updates.
The biggest downside of agent-based tools is the non-value added cost of managing agent installations. This can be a time-intensive process and many tools don't include mechanisms for locating rogue hosts on the network. Presence of these non-managed endpoints can skew statistical reporting for agent-based systems.
Native/Agentless
As OS vendors began catching up to the needs of administrators for centralized manageability, they began recognizing the value of including some of the agent's function within the native OS code. By providing agent-like code within the system and leveraging open standards for the categorization, function, and transport of that agent-like data, it grew more and more possible to manage systems purely from within OS-internal APIs.
Four components of native or agentless systems were required for the proper identification, storage, and transport of configuration and state information to independent NMS systems. Those components, pictured in Figure 3.3, are the state collection component, the storage component, the API, and the transport component.

Figure 3.3: The four components of agentless monitoring.
Your BSM implementation will likely include connections to agent-based as well as agentless management components.
One major requirement—and arguably the requirement that delayed the large-scale incorporation of agentless systems—is the need for industry agreement on the API and transport component. Think about the receiving NMS system. For that NMS to properly work with numerous agentless systems of different vendors and classifications, economies of scale in terms of APIs and transport protocols is necessary. Otherwise, the NMS vendor would need to code individual interfaces for each type of system and each type of on-board API—something they are likely not going to do due to cost implications. So until that industry agreement was realized, there were few entries into agentless NMS.
Agentless systems also include both pros and cons as components of their architecture (see Table 3.2).
Pros | Cons |
Remote management capabilities (similar to proprietary systems) | Greater processing requirements at the NMS |
Agent protocol is often network agnostic | Higher network utilization |
Little to no agent management | Not all capabilities supported |
Agent capabilities come as part of O/S upgrades | O/S upgrades required to gain new agent functions |
Table 3.2: The pros and cons of agentless systems management and monitoring.
As you can see from Table 3.2, the agentless architecture is not necessarily a panacea for solving the problems associated with proprietary agent systems. Agentless systems introduce problems of their own as they solve others. The major limitation of agentless systems lies in their inability to rapidly add new capabilities, relying on those built-in to the system to provide the brunt of the functionality. OS vendors also typically update their code less regularly than would the vendor that supplies an agent. Often, an OS vendor will update their APIs only at major milestone code releases. Thus, additional functionality can take an extended period of time to be realized in the market.
Focus on Value
Our last phase in the timeline actually moves away from evolving the management components on the individual endpoints. This phase engages itself with the addition of logic for things like service contract fulfillment, service-based solutions, framework fulfillment, event integration, service monitors, and end user response time evaluation among others. This phase in the timeline of management and monitoring concerns itself less with the data collection and more about improving the quality of the collected data, so its integration is decoupled with individual endpoint management. Incorporating the logic addition means few if any changes to the individual endpoints.
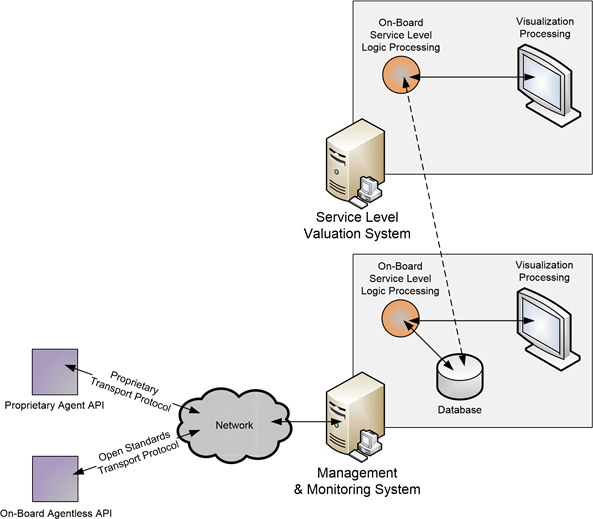
Figure 3.4: Valuation in NMS' arrives as a Service Level Logic Processing component either within the traditional NMS or separate from it but leveraging its data collection capabilities.
In fact, this addition can operate as a function segregated from the NMS itself, operating as a tool that leverages NMS-collected data for further processing. The lesson here is that wrapping a value system on top of existing NMS systems allows for the continued use of those systems while non-destructively adding the value recognition system into the operating environment.
Let's take a look at each of these example capabilities in turn:
- Service contract fulfillment—Many organizations have been using Service Level Agreements (SLAs) either between IT and the business or between IT and its external service providers. By incorporating higher-quality, data-centric and user-centric information into the recognition of that contract, more accurate fulfillment is realized.
- Service-based solutions—Performance metrics can be introduced into existing IT Services to validate their efficacy to their consumers.
- Framework population—IT frameworks are only valuable once they are populated with data. The introduction of management and monitoring into frameworks brings value to their end results. Many IT frameworks assist with the troubleshooting and resolution process but may be cumbersome to implement during times of critical outage. When data is automatically populated into these frameworks, their use during outage incidents is likely to provide more value.
- Event integration—Disparate components typically provide eventing information to their consumer, but the segregated nature of these components complicates system-wide troubleshooting. By integrating the event information from all the components of a system, a longitudinal or time-based analysis of system health is much easier obtained.
- Service monitors—Combining eventing and performance information from multiple systems into a central repository and applying logic to that data, the administrator can get an ultimate view of total system health.
- End user response time evaluation—Compiling response time information for components across entire systems, when combined with the right programming logic, enables metrics to represent total system response times. But this comes only from crunching performance counters for all elements in a system and then relating those numbers to end user or consumer experiences. Once this effort is completed, notifications can be issued to alert whenever such response times exceed pre-set thresholds or violate SLA requirements.
BSM is one tool that enables each of these components to be added into an existing NSM environment. BSM implementations typically do not involve a "rip-and-replace" of existing tools, so their incorporation is a low-risk activity. As we'll discuss in Chapter 8, BSM software typically arrives with sets of data collection tools and aggregation functions to pull data from existing NSM tools, both those that incorporate proprietary agents and newer agentless tools. Because BSM can ingest data through multiple disparate toolsets, it enjoys the pros of each toolset while pushing down the responsibilities of each toolset's cons onto that toolset's data collection system. With this understanding of the timeline of management and monitoring, let's continue our historical analysis to discuss how the targeting of service management has evolved over the years towards the need for BSM's concept of service quality.
The Evolution of Service Management Targeting
Over time, business networks have come to recognize more and more of their internal services and the components that make up those services need to be brought under formalized management. This evolution started early on with the need for a stable network underpinning. As system elements grew more reliant on each other and on elements higher up in the stack, those components too became critical for the successful operation of the overall system. Figure 3.5 depicts the elements of Service Management as it grows in maturity. More mature organizations focus their attention closer to the middle and view the outer three elements as data feeds to End User Experience, Service Level Management, and BSM. What you'll see in this section is an organic movement towards higher-level system components and eventual layers of abstraction over those systems.
As you read through this section, you might want to compare the components managed here with those currently under management within your own network. The following subsections intertwine with the levels of the IT maturity model discussed in the previous chapter. Thus, the more recognition of monitoring needs within your network indicates a higher level of process maturity within your IT organization.
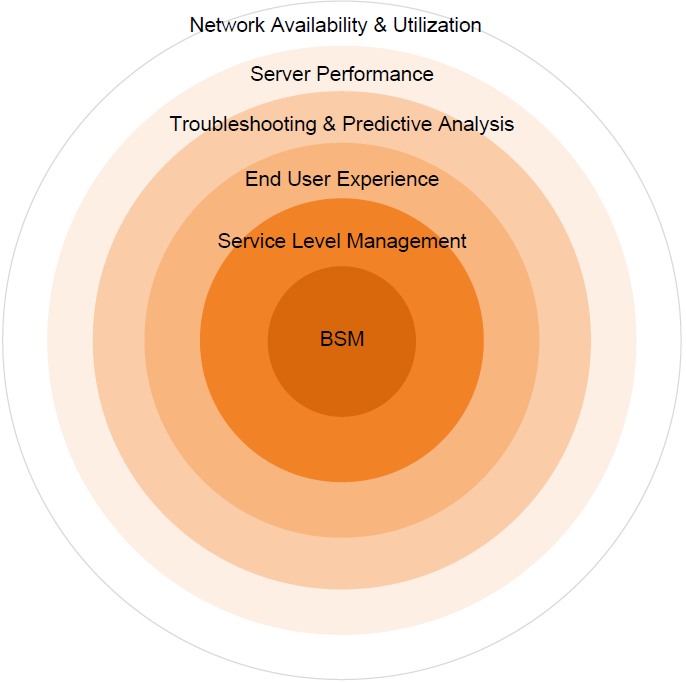
Figure 3.5: The elements in Service Management targeting center towards BSM's service valuation.
Network Availability and Utilization
The network is the common intermediary that all computer systems rely upon. Adding to this is the multi-server nature of most business systems today. In today's networks, with rare exception, any form of data processing requires the cooperation of numerous systems connected by the network for proper functionality.
Thus, it only makes sense that this common touch point was usually the first component to come under management and monitoring for most networks. When the network goes down, virtually all data processing comes to a halt. As today's networks require constant uptime in order to complete their daily tasks, any outage of the network becomes quickly critical.
Going beyond simple availability is the need for proper management of network utilization and performance. Data processing needs as they move from system to system can require varying levels of network bandwidth for their completion, and the management of that bandwidth and its use is highly critical. Highly immature networks do not typically have any measure of network utilization understanding. Thus, it is common for new services to be added to the network until a user-noticeable change in performance is realized.
Like the old saying "Once you're thirsty, it's long past the time you should have taken a drink," it is critically important for the stability and continued operation of the network for its managers to understand what kind of data traverses it and at what volume. Understanding these calculations goes far to ensuring that network augmentation activities occur before they're needed.
Server Performance
As the business grows more reliant on its network, each of its individual servers that make up a data processing thread grows more important. Early businesses leveraged centralized computing for most data processing, which meant fewer endpoints to monitor for problems. But as interdependence of servers in a path became more complex, the computing model grew to a heavy focus on decentralization and those endpoints grew geometrically. Moreover, data processing requirements can be drastically different based on the needs of its consumers:
- Resource-intensive operations can occur at times that conflict with other needs.
- An overabundance of users performing similar pipelined activities can flood a system thread.
- The scheduling of network infrastructure activities, which can be very highly resource intensive, can conflict or interrupt business data processing.
We've already talked about the complexities associated with the business calendar. Once a business begins engaging in e-commerce or worldwide operations, the issues associated with multiple time zones complicate the scheduling of business processing. This scheduling involves complex mathematics (and therefore software and processes) to ensure conflicts do not occur.
Because of the growing needs of the business for always-on processing, the management and monitoring of these activities and their impact on server performance grows as the business' reliance on its infrastructure grows. Incorporation of performance management and monitoring activities on individual servers ensures the visualization of resource use in a way that is actionable by its administrators and capable of being planned by IT and business analysts.
Relating this need to BSM and our discussion on IT maturity, the problem with server performance is usually not the recognition that it needs to occur. Rather, the problem often is in what to monitor. With thousands of potential counters on each system, and differing counters based on system or device type and installed applications, incorrectly "separating the wheat from the chaff" in terms of counter efficacy is an inhibitor to good server performance management.
Troubleshooting and Predictive Analysis
Once an organization understands its network and the servers that reside on that network and incoming data is tuned such that monitors are watching for valued data, only then can that data be used for troubleshooting and predicative analysis. If you fully understand the incoming data that you want to receive, you can relate that to the data you're actually receiving.
Through logical subtraction of these two elements, we can begin analyzing the quality of the services under management:
- When performance data goes above thresholds, we can recognize and resolve a resource overuse situation.
- When availability data consistently goes under thresholds, we can predict when to implement compensating mechanisms for load balancing or failover states.
- As we recognize new consumers of data on-system, we can add processing resources to handle the load.
It is within this phase that we can begin assigning thresholds to individual system states. Later, we'll augment those thresholds with an assignment of quality. That quality assignment eventually becomes the dollars and cents valuation needed to implement BSM.
End User Experience
Troubleshooting system problems only gets you so far. Sometimes when an application residing on a server is having problems such that users are unable to complete their necessary actions, those problems don't necessarily manifest into server-level counters. The network as an aggregate may not expose enough visibility into the problem to indicate that there is indeed a problem.
In these cases, End User Experience monitoring capabilities are necessary to relate the user's experience in quantitative terms. They are also critical before committing to formal SLAs and to the ongoing management of service levels. These tools combine agentless monitoring for visibility into all users, all the time and synthetic transactions for consistent, proactive management. They probe deep into attached applications to determine the speed of transactions, page refreshes, and ultimately the user's experience using the application.
These tools are particularly useful when the business begins utilizing e-commerce applications on the Internet. The typical Internet user is willing to wait an average of 4 seconds between clicking to accomplish an action and receiving the result of that action. E-commerce sites are often selling commodities, so results that exceed user thresholds often lead to a loss of business to the site. If a Web site consistently experiences extended delays or downtime, users lose trust in the site to successfully complete their business transaction. Businesses that find themselves with an excess of "customer drop rates," or customers who begin a transaction but don't complete it, often find that End User Experience monitoring enhances their ability to determine exactly where and why those dropped customers leave the site.
Moreover, End User Experience monitoring speeds the time-to-resolution metrics for critical performance and outage issues on customer-facing sites. As the business grows more reliant on e-commerce as a line of revenue, the functionality of these tools becomes more critical to operations.
J2EE & .NET Application Performance
As an offshoot of the Server Performance, Troubleshooting & Predictive Analysis, and End User Experience stages are the specific counters and activities associated with application performance—specifically those applications residing on J2EE or .NET platforms. As managed code, these high-level programming languages incorporate specific pluggable APIs whereby state information and performance data can be measured by specially coded monitoring applications.
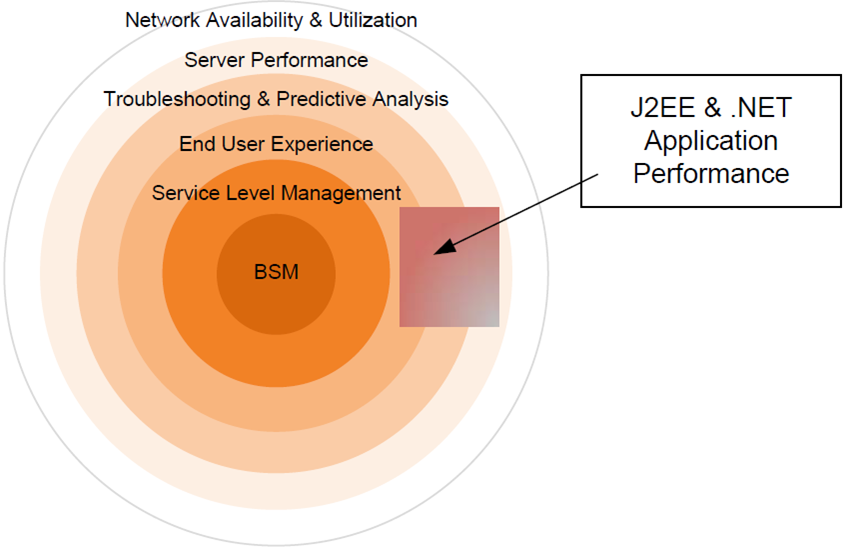
Figure 3.6: J2EE and .NET application performance bridges the layers of Server Performance, Troubleshooting & Predictive Analysis and End User Experience.
These types of applications are specifically called out because of the nature of their pluggable monitoring interfaces as well as their custom nature. Many businesses have incorporated custombuilt applications on these platforms for the purposes of business-specific data processing. Often, these types of applications are coupled with Web front-ends and customer-facing interfaces, making them highly critical in the eyes of a business' customers.
Unlike Commercial Off The Shelf (COTS) software, these home-grown applications are built inhouse and may not necessarily contain needed management interfaces within their proprietary code. Therefore, the best way to manage these types of applications is often through the APIs within their residing code frameworks. As an organization leverages more of these home-grown applications residing on pluggable frameworks, the more their critical operations rely on them. Mature organizations leverage tools such as these for End User Experience to monitor and manage them.
Service Level Management
Evolving our management and monitoring tools to the modern day, we begin considering the value of IT service levels as a component of business processes. Once we begin losing our techno-centric valuation of IT metrics in favor of relating them towards growing and supporting the business as a whole, we elevate our vision of IT systems towards Service Level Management and eventually BSM.
Here within Service Level Management, we begin to focus on how IT services underpin business objectives. The data generated through Service Level Management tools elevates SLAs beyond individual device availability and towards a holistic view of the system.
Relating back to the earlier example, if an individual network router goes down, the executives of the business won't likely care about the outage if the total capabilities of the system are not negatively affected. There, because the router was installed with a redundant, high-availability configuration, the outage of a single router did not affect the total system health. Thus, in a fully realized Service Level Management scenario, the router's state change should not have been elevated to the executive's level of digestibility.
Service Level Management data feeds into SLAs by providing the data that allows those SLAs to be managed and valuated in real time as well as historically through a data-driven approach. Knowing immediately when SLA breaches occur and tying that information into the Troubleshooting & Predictive Analysis components of earlier iterations means that an SLA breach can be quickly remedied through automated troubleshooting tools. Additionally, data gathered through End User Experience tools can augment traditional SLA metrics such as server and network uptime with key metrics like service response time and component availability. These new metrics are beneficial to the business in terms of relating its service quality to the value of its user experience.
Beginning to be realized here as well are the incorporation of advanced visualizations, commonly realized as dashboards customized to the level of their consumer. These advanced visualizations are designed for the purposes of enlightening their reader on the system state information of interest to the reader. Dashboards and dashboard design are two major components of BSM as well. Before incorporating BSM's tenets into our dashboard conversation, we need to recognize that at this step, the business is willing to provide information regarding system availability and health to multiple classes of consumers.
Business Service Management
BSM lays on top of Service Level Management by fully realizing the tie between the business bottom line and IT Service states. Augmenting the visualizations initially created by Service Level Management tools with quantitative information about service quality, BSM in effect becomes the tie between IT Service state and the corporate bottom line. Within a fully realized BSM service model are the linkages between individual IT elements, their relation with each other, the business services they support and most specifically the dollars and cents valuation associated with a reduction in the quality of the business service.
As you can see, with the ties between individual services being many and complex, the mathematics involved with calculating service quality's impact on budgets are also highly complex. This reason, combined with the necessary state logic, explains why BSM tools are late to the game compared with the other tools described in this section.
As you'll discover in Chapter 4, depending on the level of maturity of your monitoring systems presently in place, the granularization of services required to fully realize a BSM implementation may or may not involve a lot of work. The combination of what you've learned in this chapter with our discussion from the previous chapter on IT maturity should give you some idea as to the complexity of the full design.
An Example
Let's now take what we've learned and incorporate it into a real-world example of a business system, exploring how the management and monitoring of that business system can evolve from network availability through each of the layers discussed earlier, ending up with a BSM realization. In this example, we'll look at a simple Web-based customer-facing system, hereto referred to as "the system." That system is comprised of the components identified in Figure 3.7.
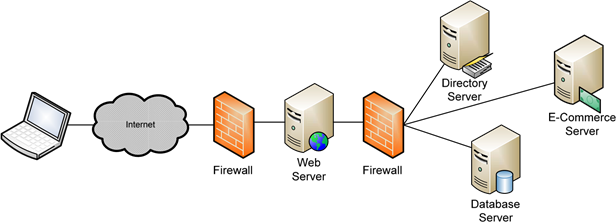
Figure 3.7: Our example system includes twelve components. Each component's role is critical to the operations of the system.
As you can see in Figure 3.7, the system encompasses twelve individual components:
- The external firewall between the Internet and the DMZ
- The internal firewall between the DMZ and the intranet
- The Web Server in the DMZ
- A directory server
- An e-commerce server
- A database server in the intranet
- And the six network connections that interconnect them to each other and to the Internet
Each of these components must work in concert for a customer from the outside to properly connect to the Web server, locate the item they want to purchase, create and make use of an account, and purchase the item. The outage of any of these components will involve a related degradation to the total service quality to this system's customers.
Network Availability and Utilization
What should be immediately obvious, even to the inexperienced observer, are the linkages between each of the components in this system. Notwithstanding the single connections between components shown in the picture, the loss of any single component negatively impacts the ability of the system to service its customers. If the system's Internet connection goes down in the middle of the night, the system won't be able to service customers attempting to purchase items. Additionally, should this business release a new product or product update that causes its customers to want to purchase the item in large numbers, the network utilization between disparate components could get oversaturated. Notification during these types of events that the network is oversaturated will help to identify that there is a "run on the product."
Server Performance
Going one step further in the obvious components of our system, it is likely that the owners of the system will also want to know how utilization of that system by its customers affects the total performance of the system. As we discussed earlier in this chapter, at this phase, we're merely looking to see overall component performance as a measure of the system's capability to service its customers. As an example, if the resource metric % Processor Use elevates above 90% for the E-Commerce component, there is a reasonable expectation that the system may be having issues keeping up with the demands of its incoming customers.
Troubleshooting and Predictive Analysis
Once we begin understanding the nature of the system and the customers incoming, we can begin leveraging historical data against a point-in-time analysis to determine the efficacy of the system. For an example of predictive analysis, if we have recognized that % Processor Time for our ECommerce system tends to operate within 60 to 70% utilization during heavy periods of use, we can predict that an extended period of 90% utilization may reduce the E-Commerce's ability to perform its function by 25%. We know that when the E-Commerce system's utilization goes above those thresholds, the approval of our users' credit cards will take 11 seconds rather than the typical 6 seconds.
Moreover, we can add troubleshooting breakpoints into the system. In the situation when the ECommerce server goes above our desired thresholds, we can add a secondary processing component—perhaps one that is offsite and contracted for use in burst situations only—into the management of our system. Our management system can watch for performance thresholds and reconfigure the Web server to use the backup system when conditions occur.
End User Experience
Believing that 90% processor utilization for the E-Commerce system is a bad thing may not necessarily give us the data we need to recognize added pain on the part of our users. Once we've evolved our monitoring capabilities to a certain threshold point and/or added the necessary technology to the mix, we gain the ability to "feel our users pain" by illuminating the experience from their perspective.
But how is this different than simple Server Performance? In quite a few ways. Server Performance metrics will provide for us a whole-system understanding of the resource use on a system, but they will not tell us how many seconds it currently requires a user to complete a page refresh when switching from item to item. It cannot tell us how long a credit card takes to process. If 90% processor utilization on the E-Commerce system actually occurs from time to time due to pipelined credit card processing operations, it is possible that that condition does nothing to impact the time delay on the part of the user. Our expansion to an expensive secondary processing component based on whole-server metrics may be costing us revenue that our users aren't worried about.
Managing our Web site from an End User Experience level means that we gain the perspective of the user without needing to sit in front of the Web site. It provides us with the notification capabilities to recognize problems the users are seeing and react to them when the users perceive it is necessary.
Service Level Management
Once we've elevated ourselves to Service Level Management, it can be argued that the majority of the data collection needs for our system have been realized. Now we need to tie that data into goals that allow us to measure success on the part of the system. Our organization can begin creating SLAs between the business and the systems administrators (typically IT) to provide goals and measurements towards those goals in keeping the system operational.
But this is only one way to use our collected data in support of our system. Our system relies on components out of the scope of control of even our internal IT organization—its Internet connection and the backup E-Commerce system we contracted for in our Troubleshooting and Predictive Analysis steps. Even though the organizations that provide these services for us typically provide their own SLA to us validating their quality of service, it is often up to us to police those agreements.
Adding the logic associated with those agreements into the data collected by our systems gives us the real-time capability to recognize failures from our suppliers and take action based upon those failures. Additionally, the pairing of the business data relevance with the technical data we've collected to this point enables the building of heads-up dashboards that begin to make sense to individuals outside the IT organization.
Business Service Management
Once we've reached the level of successful Service Level Management, the incorporation of BSM into our reporting structure enhances our data visualization with real-time and historical recognition of the revenue or costs associated with the system. Dollar values are applied to each of the twelve components in the system, and our dashboards gain financial relevance to the rest of the business.
What we also gain by adding business goals into our monitoring data are hard statistics that help us better make informed purchases as to system augmentation. Once our service model for this system is complete and filled with the appropriate business data, we can determine where the chokepoints are in our system and compare the cost to upgrade metric alongside the cost of poor quality metric. This grants us the privilege of making informed augmentation decisions, justifying additional components and features within the system. Every decision made here bases its information on data gathered and analyzed from each of the earlier elements.
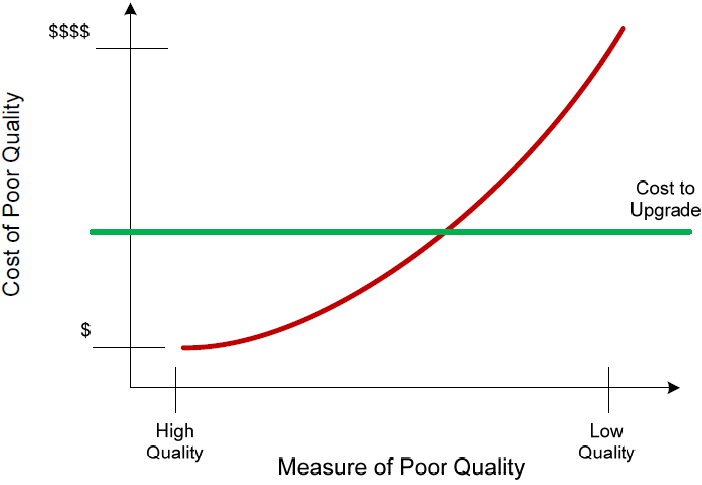
Figure 3.8: The data in BSM's visualizations can correlate the measure of poor quality alongside that measure's cost of poor quality and superimpose the cost to upgrade to help make better management decisions.
Moving Along the Evolutionary Curve
Obviously, moving along the evolutionary curve that this chapter describes needs to provide some benefit back to the company for the company to engage in each subsequent activity. As a company recognizes the positive value in evolving from state to state, they invest the time and money necessary to incorporate the tenets of that evolutionary state into their production systems. Let's look at four ways in which moving along the evolutionary curve directly affects the bottom line.
Speeds Troubleshooting
More data does not necessarily help with troubleshooting. In fact, more data often inhibits troubleshooting processes as administrators find themselves awash in a sea of raw information. It is higher-quality, business-centric and user-centric data that goes far in speeding troubleshooting. That higher-quality data arrives as a component of each evolutionary jump. Reaching the higher stages means that the data feeds into more refined models, and those models are more understood by their consumers.
Improves Performance
Knowing the performance on a system means you can impact change in that performance. Starting with network and working into whole system performance, the administrator immediately gains a very rough insight into the inner workings of that machine. But trying to look at whole system data to track down a deeply application-based problem is like cutting your grass with a chainsaw. The solution works, but it's not adapted specifically for the problem. Moving along the evolutionary curve results in data that is more tightly focused towards the problem domain. Adding to this is the nature of monitoring data itself. As monitoring data and the tools that visualize it grow in quality, it gains drill-down capabilities to narrowly define the issues that are affecting performance.
Fills Out Systems Vision
Computer systems are unlike physical systems in that it is not possible without tools to see the electricity as it goes by on the wire. When building a physical system, it is easy to visualize the machinations of the system because they're right in front of its operator. But computer systems require specialized tools just to see into the system.
Incorporating the correct suite of tools alongside the right process framework with which to use those tools helps the operator better see into the inner workings of the system. Adding advanced dashboards provides for better management decisions by non-technical users as well.
Enables Proactive Management
As stated in the previous section, it's difficult for non-technical users to fully manage a system when they don't have vision into the workings of that system. Leveraging instrumentation and effective data processing of that instrumentation data means that managers can manage best. Computer systems are meant to ease processes in the physical world, and not complicate them. Thus, making the use of those systems as easy as possible for the individuals who need to manage their interface with the physical world enables IT to make better, more proactive management decisions.
Summary
In this chapter, we've added a technical understanding to what we learned in the previous chapter on the culture of IT organizations. Here, we've discussed BSM's relation to the bigger picture of service management and monitoring as well as provided a historical basis for how that vision came into being. We've talked about the evolution of service management and the targeting of service management to elements within the business system. Along with that, we've taken what we've learned and provided an extended example detailing how the movement along that evolutionary curve improves the quality of information coming into the business on the health and quality of their critical systems. Throughout all of this, we've talked about how each element in the history of service management eventually makes its way to BSM.
In the next chapter, we'll move away from our introductory conversations on BSM and dive straight into the process of implementing it into a production environment. That discussion will involve the eight steps of a BSM implementation: Preparation, Selection, Definition, Modeling, Measurement, Data Analysis, Improvement, and Reporting. For each step, we'll discuss the necessary tasks and elements to complete to ensure a successful implementation.