Relating High‐Availability Metrics to Business Value
Once you have a grasp on your availability needs, you need to sell that solution to the decision makers. The reality of this process is that we, as technology experts, completely understand that one technology will meet the business objectives better than another. The trick now is to sell that to the rest of the organization, which will be both less enthusiastic and frankly not as well versed in high availability (HA) as you are. This is where metrics come into play; they serve as a translation from technology solution to business value.
Looking at the metrics from the baselines you developed and adding to that the ROI analysis, you can put together a good business picture that is relatable to those who are not necessarily technical. This is an important part of selling the HA solution because the impact of a service disruption affects the entire organization.
How to Explain Your Metrics and Show Business Impact
We looked at the metrics to measure the need for HA, now let's look at what these metrics tell you about your services. This is important because many times we can find ourselves presenting our findings while believing that the numbers alone will move people to action. Decision makers want to know not only the numbers but also the meaning behind them. So let's review the metrics for HA and how you can explain these when planning a solution.
As Article 1 discussed, your SLA is your baseline for an IT service. This is the expectation of service set by IT, the business, or both. The metrics show you the reality of how you are doing in comparison with expectations. So how do you use those metrics to show the impact of not reaching your established SLA baseline?
This process requires an information translation. You know what a disruption means to you as an IT department. It may also be apparent to those end users who are directly impacted by the loss. Thus, system‐wide HA solutions will be generally easier to sell. But what if the disruption is to a specific department? What if no other business divisions are affected by that disruption? How do you make the case for providing an HA solution for that service? Actually, the same approach works for both types of disruptions. Simply stated, you need to show what those disruptions mean in lost dollars and productivity.
Translating the Technology of HA to Useful Business Reports
The most important point to focus on when creating reports for establishing a need for an HA solution is that HA is not primarily about the technology. It is primarily about business value. Therefore, you must translate the technology and metrics into a report for management that makes business sense more than technological sense.
The reasoning for this approach is that while you already understand or have come to understand the benefits of HA, many times, those on the business side look to the magic box sitting in front of them and simply expect it to work. Not many business departments outside of technology understand hot‐swappable parts, clustering, heartbeat discovery, or many of the other technology‐centric terms. That makes it your responsibility to make the report you submit clear in business terms. Using real‐time examples of productivity and fiscal losses is an excellent way to make a solid argument for an HA solution. Cost and lost productivity are universally understood in all areas of business. Thus, you need to justify your HA solution based upon loss of money and productivity.
The previous articles spoke about using the availability scale to determine the balance between services and solution. You next need to look at how to take those determinations and turn them into a useful report. A powerful representation for this is the use of charts to visually explain the impact of failure. Let's look again at the availability chart from Article 1. This chart plainly shows that neither Application A nor Service B is meeting the SLA. But what is the ultimate business impact of not meeting these service levels. By adding lost productivity and total cost of downtime, you begin to show how these service interruptions impact the entire business (see Figure1).
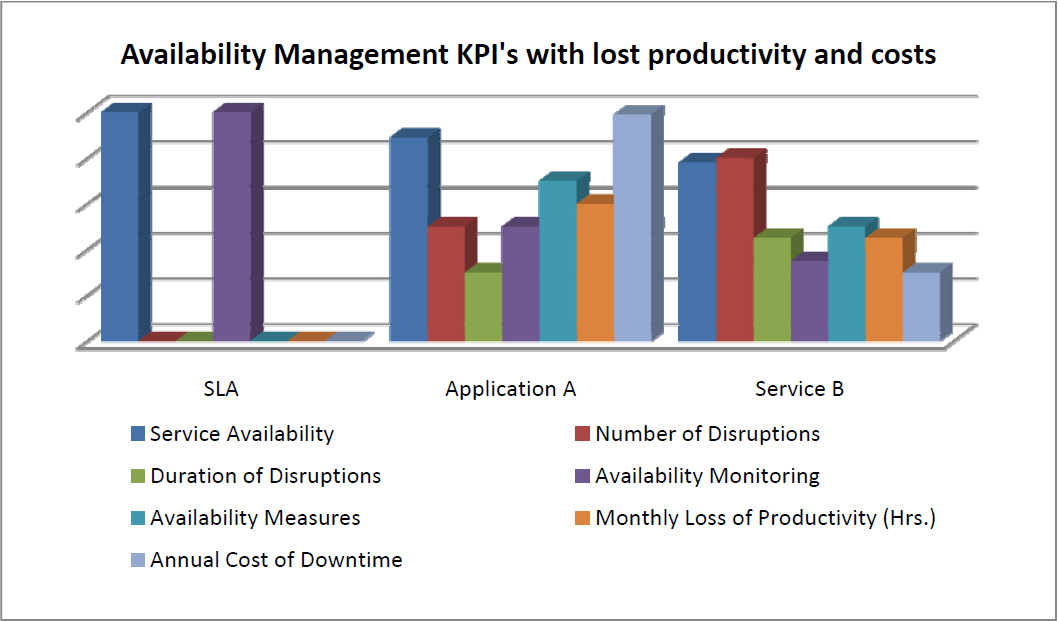
Figure 1: Availability management metrics showing the business impact of disruptions.
To show how an HA solution would improve both productivity and cost of downtime, you need to show (in real numbers) what productivity and cost of downtime represent and then how the cost factor of the HA solution does in fact pay for itself. Table 1 shows the productivity and costs of the Figure 1 chart as compared with the cost of a potential HA solution.
This table shows an example for a 75‐user organization. Application A is used by all 75 users. Service B is used only by a single department of 15 employees.
| Product Measured | Number of Disruptions per Month | Avg. Duration of Disruptions | Monthly Loss of Productivity (Hrs.) | Annual Cost of Downtime | HA Solution Cost | ROI |
| Application A | 3 | 3 minutes | 11.25 | $20,250 | $12,000 | $8,100 |
| Service B | 5 | 1.5 minutes | 1.875 | $5,625 | $2,600 | $775 |
Table 1: Calculating the ROI of an HA solution.
It is critical when considering the cost of downtime to include in that cost not only the loss of business productivity but also the cost of the IT personnel hours used to restore those services. When presenting findings, we often forget to include the intangibles (although not really billing for the hours used, these hours are being spent on restoring services rather than other IT tasks).
Table 1 represents what you have already considered in your availability scale. Application A has an IT Service Weight of 10. Although the number and duration of disruptions do not seem to have an impact, upon further analysis, the total monthly interruptions cause an annual loss of $20,250 because this application affects the entire 75‐person organization.
Service B has an IT Service Weight of 5 and the number and duration of disruptions is more frequent. However, this service is used by only15 employees, resulting in an annual loss of only $5625. Thus, it does not support a legitimate cause for the same HA solution as Application A.
This repot takes us back to what we discussed earlier: HA is not a one‐size‐fits‐all solution.
From what we can see in the table, Service B does not present the same business impact as Application A. Ignoring the loss is not a solution either; rather you need to find a solution where the cost creates a positive ROI.
So how do you calculate the numbers seen in Table 1?
- Use the ITIL metrics to measure Number of Disruptions and Average Duration of Disruptions. Add these together to calculate total minutes lost.
- Multiply the total disruption time by the number of users affected. Doing so will give you the Monthly Loss of Productivity value.
- Multiply the Monthly Loss of Productivity value by the average hourly cost of lost production for your organization (this example used $150 per hour for Application A and $250 per hour for Service B), then multiply that number by 12 for your Annual Cost of Downtime.
- Use the cost estimate for the solution to determine your HA solution cost.
- Add the expected RTO of the HA solution (this example used 1 hour annually for Application A and 9 hours for Service B) to the HA solution cost to reach your total ROI.
It is important to run the charts and tables for each service being considered for an HA solution. When going through the process, it makes sense to include all your applications, services, and data sets. At first, some may seem unworthy of an HA solution. If you look at the ROI you gain after implementing HA, you might determine that it is more costly not to implement HA. Again, to make this determination, use the real numbers for lost productivity and cost of the disruption.
Summary
Ultimately, an HA solution will benefit the entire organization. Let the metrics and the numbers do the talking—they offer a simple and straightforward look at where you stand. They also offer a roadmap for reaching your availability goals. Thus, you must be sure to include any potentially impacted business units to make selling the solution easier. If all areas of business are involved, HA will be a company‐wide solution that has been worked on cooperatively.
HA is a technology that is flexible enough to meet the needs of any size business from the smallest organization to the largest enterprise. Rather than a one‐size‐fits‐all solution, HA is a set of solutions that you can customize to create a good fit for each application and service. This perspective will enable you to sell the solution to the business units that you want to support that solution, benefitting the entire organization.