A Primer on BSM
This guide has attempted to unravel the complexities surrounding BSM all the while illustrating to you the value proposition associated with its implementation. As we've learned, BSM is a platform upon which various classes of monitoring data can reside. As we've learned, BSM is effectively a mechanism by which the goals of business are applied to the technology of IT. With BSM, IT data and metrics are ingested from numerous sources, including BSM's own internal monitoring instrumentation, and used to calculate metrics that determine the overall health of a business service.
The intent for this chapter is to provide you with a sort of crib sheet for the concepts and major topics we've discussed throughout each of the previous chapters. As a Definitive Guide, this book is intended to be fully comprehensive in the story it attempts to tell. But sometimes what you really need is a down-and-dirty explanation with plenty of useful images to be used in helping others understand the utility and value associated with BSM. That being said, this chapter intends to wrap up our conversation on this topic as well as reiterate the critical concepts and takeaways discussed in each of the earlier chapters.
BSM—More than Just a Framework
Throughout this guide, we've started each chapter with a story. That story has told the tale of John Brown and Dan Bishop's iterative embrace of BSM as a solution for quantitatively illustrating the quality of their online B2B Web service. The story started out in Chapter 1 with what appears at the outset to be a common problem in any IT environment. There, what was originally believed to be a "minor IT system" went down one night. But that system was quite a bit more important to the functionality of FCG's entire Web system. Its outage resulted in a 6hour loss of order state information for special orders placed through the Web service.
During that 6-hour outage, every order placed ended up in an incomplete state. Neither the individual placing the order nor FCG itself knew the status of the order. As a result, FCG's ordering department was forced to go through a highly time-consuming and costly reconciliation process to determine the state of each order and work with its owner to resolution. This added activity was expensive enough to significantly affect FCG's quarterly numbers. What we learned over the course of each chapter's example story was how an iterative approach to a BSM implementation in the end significantly benefitted FCG's ability to make better business decisions as well as track and resolve problems as they occur.
The Chasm Between IT and the Business
A critical issue throughout the storyline in each of the early chapters was a dissonance in language and priorities between the IT department and the rest of the business. This "chasm" between IT and the business occurs in organizations even today. IT has a tradition in viewing the computing environment from a device-centric perspective:
- The router is up today.
- The servers are functioning.
- The network is slightly slower than usual.
But there's a problem intrinsic to this device-centric approach to IT operations: It doesn't mesh well with the goals of the business as a whole. Businesses continue to operate because they successfully complete transactions with their customers. Those transactions can be services provided by the business or inventory sold to customers. IT systems in these sorts of businesses are responsible for the processing of those transactions, and it is the individual transactions that are ultimately most important to the processing. Without those transactions, the business cannot meet its goals.
As we'll discuss a little later in this chapter, this "chasm" between IT and the business occurs due to issues with the level of IT maturity. This descriptor doesn't necessarily attempt to explain the behaviors of IT individuals; rather, it discusses the level of repeatability, automation, and proactive capability of IT to support the needs of the business. When IT can fully support those needs in a proactive and measured way, we can think of IT as being mature. BSM is one solution that assists with the process of maturing IT to align with those business goals.
Business Services
One critical requirement for a BSM installation is the need to tie BSM to those business goals. To that end, it is important to consider the services enabled by IT. As part of that consideration, BSM is designed to work best when aligned with what we consider business services. As Chapter 1 describes, "a business service at its most basic form is one whose operation can be quantified in terms of dollars and cents."
Thus, typical IT infrastructure elements are not the main focus of BSM. Instead, those services that ultimately drive income to the business and can be measured in whole dollars are critical success points for a BSM installation. We say this because one key component of BSM is in identifying the dollar profit or loss associated with the quality of service processing. When a service is of high quality, that service is able to meet the needs of its customers. It is able to fully accomplish its intended task, and it contributes positively to the bottom line of the business. From Chapter 1:
BSM is effectively a mechanism by which the goals of business are applied to the technology of IT. With BSM, IT goes about a reconfiguration of the way it considers technology—adding to the traditional device-based approach it begins embracing a service-based approach to monitoring. This embrace of technology in terms of business services means that individual outages are treated as profit-and-loss events for the business. A loss in a subsystem to a business service feeds into the total quality of that service. A reduction in the performance of a system reduces its quality. And, most importantly, a decrease in response time for a customer-facing system reduces its service quality.
By layering a BSM installation over the top of existing IT monitoring solutions we can begin proper monitoring of that quality metric across a spectrum of interfaces, metrics, and types of instrumentation, and begin to see business service views. We also gain the ability to break down the very large concept of the "business service" itself into its individual components. This granular representation of the overall business service creates what we call the service model. This service model along with its interconnections is used by BSM to identify how the various elements of the service work together. BSM then becomes a type of calculations engine that melds this performance data, compares it against preconfigured limits and thresholds, and develops conclusions about the ultimate health of the service.
Figure 10.1 shows an example of how this works. Here, we see the completed service model for a "Mission Critical B2B Web System" not unlike the system discussed in our chapter examples. In this image, we also see how a decrease in transactions per second below a stated threshold for the Inventory Database element causes an upstream delay in the Inventory Processing System and the Order Processing System elements. The ultimate result of this seemingly small problem is that customers grow unhappy with the performance of the site.
As you should immediately see in this representation, when the level of instrumentation grows beyond simple device monitoring and towards transaction-level monitoring, the visibility into root causes of customer dissatisfaction grows significantly more powerful. This power enables businesses to make better decisions about how IT-based services are positioned to the customer. It also provides a quantitative measurement by which IT can perform better planning activities towards system augmentations or additional services.

Figure 10.1: What appears to be a simple problem with an Inventory Database can quickly impact the entire system as a whole, ultimately causing user dissatisfaction.
Dashboards and Service Visibility
Being able to capture and calculate all this data is all fine and well, but without a way to display this data in a form that is useful for its consumer, this data is effectively useless. Thus, the end result of any BSM installation is the preparation and rendering of comprehensive dashboards that illuminate the health and quality of the underlying business service. This third component is illustrated in Figure 10.2, where we see how raw data is brought into the BSM system, calculated and compared against preconfigured conditions, and ultimately reported on through visualizations.
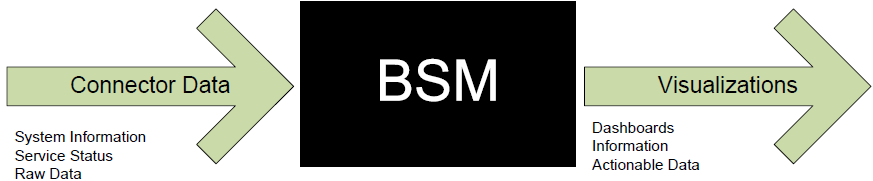
Figure 10.2: BSM is involved with three components: raw data input, calculations, and visualizations.
At this point, you may be thinking, "But any IT monitoring product can display images associated with system behavior." This is in some ways true. Most traditional IT monitoring products have the ability to alert and notify through some form of visualization. But a BSM solution is different in that one of its central tenets is associated with the digestibility of the data being presented to its consumers:
- A business executive cares about different things than does an IT administrator
- An IT administrator wants a different view than an IT manager requires
- A business analyst is interested in yet different metrics
Each of these groups is incentivized to pay attention to different parts of the business, and because of this incentivization, each needs to see different types of data. The biggest benefit of a BSM solution is that its internal calculations along with its rich visualizations engine can provide the data needed by each of these groups of people. Also from Chapter 1:
If the BSM system can provide information related only to downed server names and log data surrounding an event, an executive is not likely to pay attention to that system. If the system can provide digestible information to the executive—the name of the business service affected, the number of whole dollars associated with the reduction in QoS, and how that service's outage affects other services—the executive will be empowered to make educated decisions.
If this chapter is your first reading into the story, you should now immediately see where BSM can be very powerful within a business. For most of the history of computing, IT has traditionally used comprehensive alerting mechanisms to notify IT when problems occur with their systems. These systems can send notifications to mobile devices while updating graphical interfaces with information about the health and quality of systems under management. Yet these same capabilities have only recently made their way out of the Help desk and into the boardroom. Figure 10.3 represents an example of how this might look for an executive.

Figure 10.3: An example dashboard for an executive audience, showing data that would be interesting and useful for their job role.
The same data that is gathered by the BSM system for use by IT can be reformatted for consumption by business executives such as what is shown in this example. Here, BSM is monitoring transaction information to provide data about the health of the business itself. Rather than seeing information about IT devices that are functioning or non-functioning, the business executive using this view gains a single-glimpse view into the status of business-centric metrics such as rate of approvals, technical services, call center metrics, and the like.
Using BSM's unique calculations engine along with its ability to turn data into useful graphical representations, non-technical executives for the first time can see into the systems they are charged with managing for the business. They can easily obtain the kinds of information they need to make educated decisions about the positioning of products and services within IT-based systems. They can predict and plan for augmentations as necessary, and all the while make better decisions about running their business. All this is gathered through the same BSM solution that can assist IT with its own monitoring needs.
What We Have Learned…
Now that we're reviewed the basic elements associated with BSM and what it can enable for the business, let's take the rest of this chapter to look back through each of the major topics discussed in this guide. As you can see in Figure 10.4, this guide is intended to take you through the introduction to BSM and its genesis, why it exists in the form it does today, and through its implementation phases. We finish out the second half of the guide with a comprehensive discussion on value to management, operations, and IT before a talk on BSM's integration with common IT process frameworks like ITIL and Six Sigma. In the next few sections, we'll review each of the topics discussed in their relevant chapters, starting with a conversation about the alignment problem that plagues IT organizations that exist lower on the IT maturity curve.
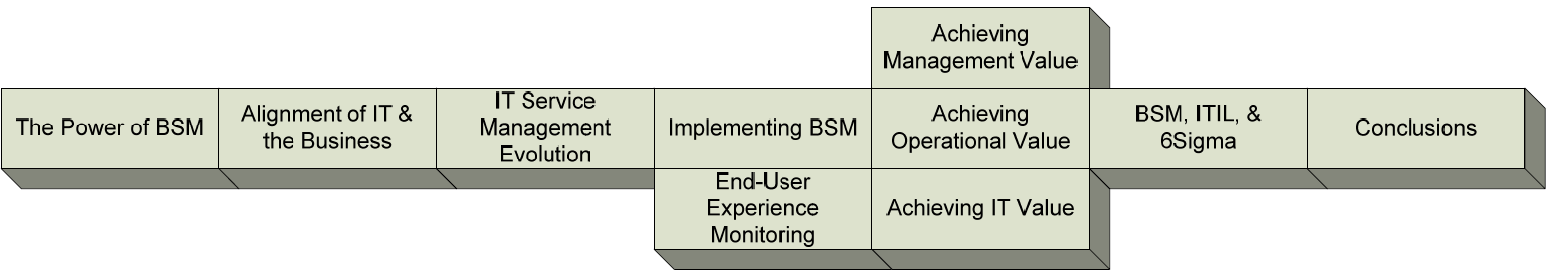
Figure 10.4: The building blocks that guide the conversation towards a holistic picture of BSM.
The Alignment of IT and the Business
A major problem with the traditional role of IT within business has to do with its relative insulation from the majority of business processes. IT in many organizations is seen as a group of people who appear when problems occur or when computers break, only to return back to their hiding places once the situation has returned to normal.
In the old days, this way of dealing with IT worked well enough. Businesses hadn't yet come to rely on IT systems for critical processing of core business functions. The business used IT technologies for limited needs through the normal course of business, but the heavy lifting remained with handshakes and non-technical means.
Today's business has changed significantly, bringing IT to the forefront as a critical component to the functioning of the business and the continued recognition of profit and loss. But with this increased responsibility has not come a linear increase in visibility for many environments. What must happen is a change in mentality away from IT as a break-fix entity to a co-equal partner in the goals of business. From Chapter 2:
The change in mentality associated with greater "building" and less "fixing" also tends to drive a change in how IT sees the employees who use the network. At some point, the IT department begins to see the users of its network less as "the people causing the problems" and more as "the people using the services." The negative connotation of "users" disappears, and the network residents become in effect the "customers" of IT.
Along with this change in how IT is viewed by the business needs to come an advancement in how IT sees and manages its own services. Gartner identifies a five-stage model associated with this maturity process, as Figure 10.5 shows. These five stages and the identifiers used to represent each stage are used to show the current positioning of IT in terms of automation, resiliency, and ability to support the needs of business. It also serves as a set of guideposts to assist with graduating an IT organization from one stage to the next.
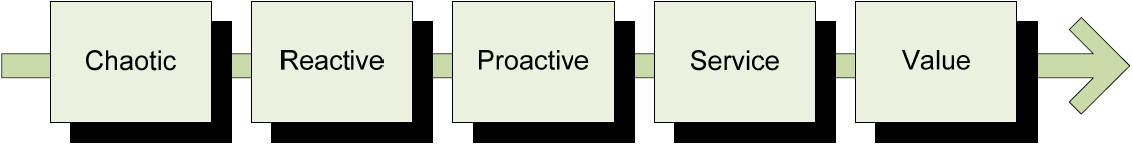
Figure 10.5: Gartner's IT maturity model identifies five stages to characterize IT's level of organizational maturity.
We focus specifically on this model because an IT organization's capability to embrace BSM's concepts relates directly to the stage in which it currently resides. IT organizations in the Chaotic stage tend not to have the infrastructure and procedural elements in place to make an easy jump towards BSM. Moving an IT organization to the right on the model tends to involve greater capability for documentation, metrics gathering and analysis, automated processes, and most importantly an organizational culture that is willing to accept the level of formality brought about by a BSM implementation
It's important at this point to say that an organization at the leftmost stages of the maturity model needn't completely avoid BSM. The processes required to successfully build and implement BSM will very quickly move that organization to the right. But that same implementation will take longer and be less effective until it does.
Chapter 2 goes into specific detail about each of the stages along with the areas of impact that BSM is likely to provide within each. Without repeating the deep explanation of those guideposts that identify each stage, let's take a quick look at the impact of each stage and the level of BSM embracement an organization can expect to obtain.
Table 10.1 is reproduced here from Chapter 2 as it is an easy-to-understand element that provides an excellent rundown of the recognizable BSM benefits potentially gained by IT in each maturity stage. As you'll see in the table, as organizations move to the right, they grow more capable of dealing with and incorporating BSM's higher-level concepts.
| Maturity Stage | Key Steps Toward BSM |
| Chaotic |
|
| Reactive |
|
| Proactive |
|
| Service |
|
| Value |
|
Table 10.1: At each level along the maturity model, an organization can move towards IT and business alignment.
The Evolution of IT Service Management
This role of IT maturity in the embrace of BSM is critical, but it's only part of the story. To understand the BSM of today, what is also needed is a discussion on where it started.
Understanding BSM's roots goes far into understanding why it has developed over time and how BSM specifically provides value over each of its ancestor technologies.
Chapter 3 talks about this evolution in substantial detail. BSM's discussion of service quality began in traditional device monitoring technologies. Chapter 3 explains:
Since the beginning of modern computing, there has been an ever-growing need for systems management and monitoring. As the number of computers that make up a network has increased, the number of configurations and manageable endpoints has geometrically increased as well. Adding even a few more systems into a network means adding dozens or hundreds of additional management touch points to that network environment.
Over time, the process of managing those touch points has evolved, starting with the early attempts at network management, through proprietary agent-based tools, resting now for many organizations with a new focus on agentless management and end user experience monitoring. What we anticipate to see in the future as we continue down this timeline is a refocusing on value in the near-term future by organizations that have progressed up the maturity curve.
What we learn through the history of IT monitoring technologies is a movement away from the traditional device-centric approaches of yesteryear. Those approaches are still relevant today for certain consumers, such as IT administrators, but an additional look into the value of IT systems and how that value impacts business agility and the corporate bottom line is what is absolutely critical in today's environments where business and IT are inexorably linked.
Our discussion into BSM's roots also goes into detail regarding the targeting of monitoring data and how that targeting has evolved over time (see Figure 10.6). In the beginning, data monitoring was highly focused on network availability and utilization. This was predominantly the case because of a basic inability to visualize activity and behavior at the wire level on a network. You just can't see the bits flowing across the wire, so visualization systems were put into place. Over time, those performance measurement systems moved into server performance, but initially at the level of the entire server itself.

Figure 10.6: Over time, traditional monitoring has evolved to discover the needs being met by BSM.
The problem with entire-server metrics is that they don't capture the true behavior of onboard services in many situations. As an example, when a service sits in a wait state, waiting on a transaction to be transferred from another system in the chain, this behavior doesn't manifest into whole-server metrics. So, IT using only these tools never sees a problem with the system.
These missing links helped evolve entire-server performance metrics into more troubleshooting and predictive analysis tools and later into the End-User Experience (EUE) monitoring tools we discuss in Chapter 5. All of these feed into the business' need to understand and manage its level of IT service and ultimately how those services tie into the business' bottom line. Each of these stages along the way is explained in great detail in Chapter 4.
Implementing BSM
The implementation of a BSM solution will for many environments be a non-trivial task. The formal identification and documentation processes required to build the service model involve a lot of work and analysis by implementation teams. Integrating that service model, once built, into the monitoring toolsets needed to gather necessary data is yet another complex task. Thus, Chapter 4 discusses the seven phases typically associated with a BSM implementation. Figure 10.7 shows those seven phases.

Figure 10.7: The seven phases of a BSM implementation.
This activity tends to be more or less trivial based on the maturity level of the IT organization. BSM's calculations engine as well as its monitoring instrumentation requires a highly formalized look at the business services in an environment as well as their interconnections. When those interconnections are not already well-understood or well-documented by the business or IT, this tends to simultaneously convert a BSM implementation into an environment documentation activity as well.
Without repeating too much from Chapter 4, the general processes associated with each of these phases resembles the following:
- Selection—The first step is to identify the services that will ultimately become a part of the service model. The idea with this phase is to identify those services that have direct impact on the business' bottom line and are considered critical to quality. Services in this phase are assessed with the end goal of finding those with hard lines defining the service and its interconnections so that it can easily be input into the service model. Also important here is the identification of Key Performance Indicators (KPIs) that have value to the business and how those KPIs relate to the services being collected.
- Definition—Once collected, a formal definition process is necessary to document the structure, behavior, necessity, and relevance of each service. Also useful here is the documentation of the potential metrics that relate to the service's operation and functionality. This information is handy for later identifying the characteristics that describe when the service is operating with good quality.
- Modeling—Once the catalog of services is identified and documented to their fullest extent, the modeling phase creates the service model itself that, in the words of Chapter 4, "will be a top-down decomposition of the business service in relation to its constituent components. One artifact of this process will be the creation of ever more detailed hierarchical diagrams identifying business processes in relation to the processes and resources that support it." Numerous tools and visualization frameworks are available to assist with this modeling process. The end result of this phase is the fully realized service model.
- Measurement—Upon the completion of the modeling phase, the next step is to add dynamic data into its otherwise static representation. This process starts the active measurement of the identified IT services and is the real first step towards making use of BSM software. This step involves the installation and first use of the BSM software, plugging the model into the software, creating the connections between the disparate monitoring capabilities and the model, populating the model with metrics and thresholds, and beginning the data collection process.
- Data Analysis—The Data Analysis phase is in many ways in perpetual loopback, with analysts constantly analyzing the incoming data arriving through BSM's instrumentation and validating measurements and costing assumptions based on the transaction responses. As instrumentation data typically arrives in a raw format that requires conversion and further calculation to be effective into the resulting dashboards, there are multiple places where that process can be in error. The Data Analysis phase watches incoming data and constantly reevaluates existing calculations and formulas to find areas for improvement. Also created in this phase are the Fault Tree and Impact Tree Analyses used primarily by IT and service administrators in the identification and resolution of root causes to problems. As we discussed earlier, today's business systems can be exceedingly complicated, so comprehensive tools are necessary to watch individual transaction performance for key behaviors. These analysis tools along with BSM's calculations data assist IT with quickly finding and resolving problems before they have significant impact.
- Improvement—When the analysis component of the previous phase finds errors or elements that need revision, the second half of the loopback is involved with improving the model's relation to reality. In this phase, the BSM implementation team revises the service model or its internal calculations to improve its abstraction of the business service. It's worth mentioning here that this and the previous phase tend to be neverending in that there are always ways to augment the service model with additional service representations.
- Reporting—Last, we come to the fun part. The building and dissemination of dashboards properly suited to their consumer. Here, we use the formatted data as received and calculated by BSM to build visualizations—most often in the form of dashboards—that illustrate to the user the health of the service and the quality of the services it provides.
EUE Monitoring
One component that we're glossing over in our discussion thus far is involved with exactly those transactions that are of interest to the BSM solution. We talked already about how entire-server metrics are not enough to fully understand the goings-on deep within the systems we're attempting to monitor. Because those metrics are simply not enough, we need another way of looking at the entire service model from a bottom-up approach—one that analyses the systems' behavior at an exceptionally low level. That monitoring approach is based on individual transactions and how they navigate throughout the IT elements that make up the service model. We call this approach End-User Experience (EUE) monitoring.
EUE takes a two-pronged approach to look at these transactions as they move through the disparate elements of the business service. These transactions may start at a Web server and may later be transferred to one or more database servers; this transfer may be routed over any number of network connections, all the while being modified by mid-tier or business logic systems in the middle. This complex path for each piece of useful data is impossible for traditional monitoring tools to capture.
EUE takes a different approach than does traditional monitoring through the incorporation of two different and simultaneous mechanisms for watching these transactions. The first is agent-based monitoring with agents that are installed to servers within and outside the systems that make up the business service. Chapter 5 includes a good explanation of agent-based monitoring:
First, by installing agents onto individual servers that make up a business service, the agents can look deeply into the processes and activities that make up that service. The agent can analyze behaviors within the server to look for individual transactions, the success or failure of those transactions, and the quantity of time elapsed to complete those transactions. Because the agent is installed directly to the specific server of interest, that agent can be configured with relatively unrestricted access to gather and report on the information it needs from within the server.
Second, agents can also be installed onto clients throughout the network. The agents on these clients are then programmed to emulate an end-user performing key business transactions throughout the day…By installing these agents on systems across the network, the EUE system can compare the results of each transaction with those of other agents to see where individual sites may be experiencing problems. In many ways, the idea with agent-based solutions is to determine the total time necessary to complete a transaction from multiple locations to help identify the characteristics and locations where poor application performance is experience.
Agent-based monitoring provides a mechanism by which the performance of individual transaction processing can be viewed from multiple points on the network. The comparison of the metrics gained at each point is then calculated to determine the service quality at each point. But in the process of capturing this information, there can also be other on-network situations such as large file transfers, backup jobs, or other network congestion. These transient situations can impact transaction performance but are not likely to be measured by EUE agents. By nature, agents simply aren't aware of transient network situations. Thus, we need another simultaneous type of monitoring to gauge the overall environment conditions. That other type is agentless monitoring. Chapter 5 continues with an explanation:
Much different than agent-based monitoring is the concept of agentless monitoring. Here, code is not installed to the individual servers that make up the business service nor are any transactions synthetically generated to the systems under management. Instead, we leverage a central solution that is configured to watch for all the traffic across the network.
This agentless solution will determine the business impact associated with any transactions that did not complete properly or within a proper amount of time.
Obviously, in order for this system to do its job, it has to understand the traffic it is receiving. If a Web server is communicating with a Web browser client, that traffic needs to be understood as a Web request followed by a Web server response. It can also be a series of requests and responses that make up a complete business transaction. This type of communication is programmatically easy to understand. Where mature EUE systems provide extra added value is when those systems can additionally translate non-Web application traffic.
Though we discuss here that EUE monitoring includes both agent-based and agentless monitoring, it is possible to install only one of these two types on monitoring mechanisms into an environment. Often, this is the case in highly secure environments where there is a security concern regarding large-scale network data collection. This being said, the quality of data received will not be as high when only one mechanism is used.
One goal with this dual approach to transaction-level monitoring is to identify where in the thread across client, networking, and servers is delay occurring. Finding those areas of delay goes far into discovering the root causes of problems with the business service. This "Client, Network, Server (CNS) Spread" provides a spectrum, as Figure 10.8 shows, between the time the transaction spends bring processed at the client, over the network, and on the server.
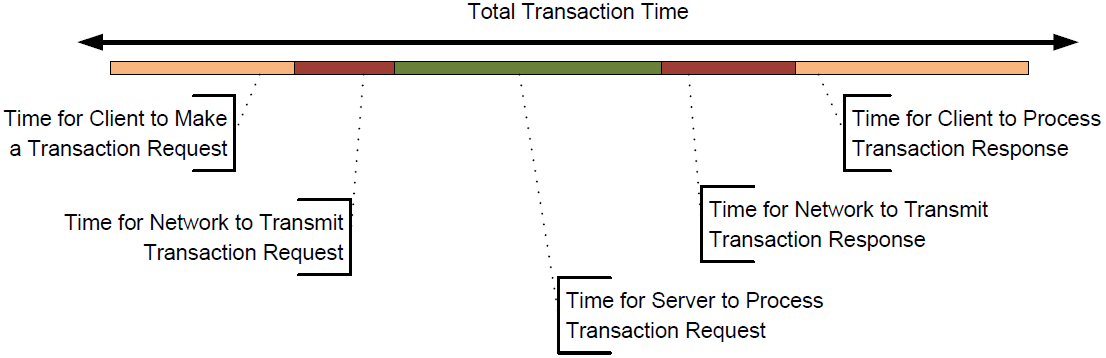
Figure 10.8: The "CNS Spread" isolates transaction timing into client, network, and server components.
The end result with all this monitoring is a deep understanding of the quality of the service being monitored. Transaction performance information is calculated through the BSM calculations engine to provide a metric that defines and sets thresholds for the appropriate level of quality. At the same time, when quality metrics go beyond preconfigured thresholds, administrators can be notified. This allows administrators to begin researching problems before their level of impact grows problematic for the business.
Achieving Management Value
Our discussion of the basics of BSM dovetails well into a three-chapter analysis of BSM's value to management, business operations, and IT organizations. In the first of these three chapters, we take a look at the management value associated with a BSM implementation from the perspective of its intrinsic ROI as well five classes of dashboards and dashboard consumers:
- Management Visibility
- Management Control
- End-User Visibility and Control
- Outsourcers and Service Providers
- Enterprise IT
Chapter 6 includes a number of example dashboards that relate to these consumers. Rather than reprinting those dashboards associated here, consider turning back to Chapter 6 to see the examples designed specifically for each consumer class.
We also take a look in this chapter at the tangible and intangible benefits associated with a BSM implementation from all perspectives. Tangible benefits here are associated with the improved capability and speed in seeing and resolving problem areas within the business service. The improved ability to determine the desires of service end users and modify those services to suit user needs is a major component of intangible benefit. Chapter 6 includes a table that breaks down these concepts by category. That table is reproduced here as Table 10.2.
| BSM Implementation | BSM Use | |
| Tangible Benefits |
|
|
| Intangible Benefits |
|
|
Table 10.2: A non-exhaustive list of value gained by an organization through the implementation of BSM. That value is broken down into various categories.
The ROI associated with BSM is also compelling when the one-time costs associated with its implementation are merged with the recurring benefits gained. A BSM installation tends to include benefits from direct cost savings as well as revenue benefits. Chapter 6 looks at a few of those benefits in detail. First, the direct cost savings associated with its implementation:
- Target problem reduction. This is the anticipated reduction in time-to-resolve for problems with BSM-monitored systems. Conservative estimates here are useful in estimating not only the amount of time saved in solving problems but also a reduction in the number of service breaches per unit of time.
- Service desk load. Concurrent with the reduction in problems is a reduction in case load to the service desk. By reducing issues that have risen to visibility by users, they are less likely to need the services of the service desk. With mature organizations knowing their metrics for the cost associated with each service desk ticket, reductions in load can be directly related.
It then also looks at revenue-driving benefits based on the metrics capable of being captured:
- Average revenue per successful transaction. This metric is the basis for many of the calculations recognized in this section. When revenue can be related per transaction, this gives us the bar by which revenue loss or gain can be related through improved transaction quality.
- Number of unsuccessful transactions per day. This metric is doubly useful during the implementation of a BSM system. Prior to the EUE monitoring that arrives with a fullyrealized BSM solution, it can be operationally challenging to measure the number of lost transactions. When that monitoring is enabled, the organization gets a first look at how many transactions are actually being lost. This first look can then be compared with others over time as BSM drives improvements to the business service.
- Average time per transaction. This metric can be the primary measurement of transaction quality when not related to a failure. The time elapsed to complete a transaction bears directly into the user's ability to complete that transaction. When users are unable to complete transactions within an appropriate amount of time, they may leave the system rather than complete the transaction.
- Total minutes used processing successful/unsuccessful transactions. This metric relates to a period of time where a count of minutes used in processing either completed or noncompleted transactions occurs. Non-completed transactions are a waste of system resources, doubly so as unsuccessful transactions often must be rolled back out of the system. Between these two metrics, a shift in time from unsuccessful to successful transactions relates to a more efficient use of available system resources.
- User drop rate. Related to the above, when users grow frustrated with an un-optimized system, they will eventually "give up" on their interface with it. BSM enhances revenue when improvement activities related to its information reduce this metric.
All of these benefits are those that the business stands to gain on a recurring basis. For example, when a business can increase their average revenue per successful transaction metric—and when they can quantitatively measure that increase—they immediately gain through the direct linkage between metrics and service changes.
The added situational awareness as a part of BSM's real-time and historical data visualizations provides analysts and executives alike with an enhanced vision into the efficacy of their decisions. It enables them to directly see the effect of their decisions on the service as a whole. Figure 10.9 is an example of this. By seeing real-time response values along with deviations from accepted norms across a spectrum of business services, the managers of these services can immediately recognize through this quantitative interface how their decisions impact business operations.
Figure 10.9: Well-designed dashboards with proper metrics enable decision-makers to see the efficacy of their decisions.
Achieving Operational Value
One advantage to how BSM is implemented in an environment relates to how it layers atop existing management and monitoring solutions. BSM needn't involve a complete "rip-andreplace" of existing solutions but instead works better when leveraging their already in-place monitoring instrumentation. Thus, a BSM implementation is often a very low-risk addition to an environment.
Figure 10.10 shows an example of this, depicting how the same instrumentation data currently being collected through existing systems management, systems monitoring, application monitoring, CMDB, and service desk systems can be flowed through the BSM solution. This tiein to existing instrumentation data only enhances the level of situational awareness possible through BSM's visualizations.
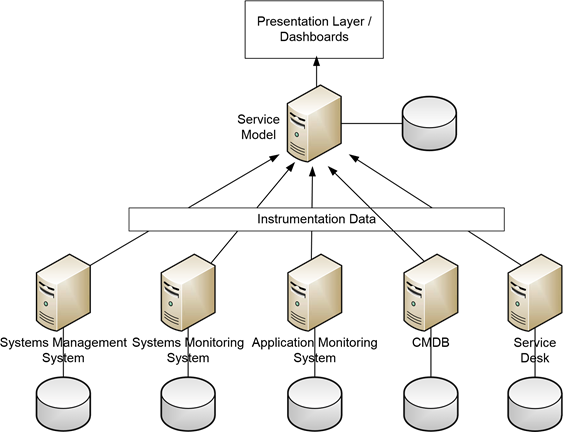
Figure 10.10: Existing systems needn't be removed to make way for BSM. Rather, BSM can make use of their instrumentation data for its own purposes.
Further, to show the value gained by operations when considering a BSM implementation, one must look at the types of information that can be provided. We've already talked about the central BSM tenet of digestibility. But this concept comes into full focus when considered in relation to the classes of data consumers that stand to gain through visualization data. From the perspective of the kinds of metrics capable of being generated, three classes of users gain realtime access to very useful metrics. These metrics assist in making good decisions about their area of focus. From Chapter 7, management and executives gain in three areas:
- KPIs. Key Performance Indicators are a central and critical meter for this group of people. At the management level, KPIs often measure the performance of the business as a financial unit. Without delving into specific kinds of KPIs, in traditionally manual systems these valuable indicators may be presented to management only at intervals. Decreasing the quantity of time between these intervals increases the resolution of the data. It increases the quality of the information being provided to management. BSM does this by measuring and reporting on KPIs in real or near-real time.
- Overall Service Quality. Related to business metrics and KPIs is the overall measurement of service quality as a whole. This single metric provides to management a singleglimpse understanding of the functionality of the business system of interest. As we'll see in the data blocks later on, visualizations associated with overall service quality can be created in ways to make it very obvious to management the exact point when service becomes degraded and when it again returns to acceptable service. Knowing this information assists them with performing their management duties.
- Business Impact. Related not only to the quality of the service being provided to a system, but also to the area in which problems are resolved is the idea of business impact. When overall service quality is reduced for a service below acceptable levels, some activity or element is the cause of that change. Often, multiple problems are present simultaneously on a system. It is important that available resources be assigned to fix those problems with greatest business impact first. The measurement of business impact provides management with critical information to this end.
IT cares about a different set of information entirely. Even mature IT organizations still require the ability to see how their actions affect IT technology. Some metrics discussed in Chapter 7 that aid IT decision-making and troubleshooting activities include:
- Service Level Statistics and Compliance. Mature IT organizations should have mature SLAs in place for managing their relationship with the business. As stated in previous chapters, the problem with many SLAs is in determining the quantitative measurement of their fulfillment. As a manual task, this can be highly time-consuming and provides results only at intervals. The calculations within a fully-realized BSM instance can do this automatically and at regular intervals. By providing proactive SLA information at more regular intervals, IT can better gauge how changes to the environment directly impact service quality.
- Mean Time to Restore. Problems within IT environments are a fact of life. Issues with complex computing equipment happen all the time. Managing how those problems are resolved is one of the major tasks of IT management. The fulfillment of this metric helps IT understand how well-positioned are their resources. It also helps them reposition resources to better fulfill problem resolution.
- Application/System Performance and Availability. Performance and availability in terms of both applications and individual systems assists IT with identifying bottlenecks within systems. When either of these components experience low performance, hardware upgrades may be likely. Measuring this performance over time helps IT plan for these needs ahead of time, preventing costly short-fuse upgrades. In terms of availability, IT's long term measurement of availability helps justify purchases as well as validates the work being done in support of their systems.
- Affected Users. As discussed above, identifying the affected users and the level of affected users assists in positioning troubleshooting resources in the best way possible. When multiple problems occur simultaneously, relating the problems to the number of users being affected by the problem means that higher-impact problems are resolved first.
- Application Processing Provisioning. Lastly is the identification of levels of resources needed by individual application processes or threads. When throttling is enabled on system resources, BSM provides data to assist IT with identifying the correct levels of resources to provision.
Lastly, the end users of the system stand to gain through an added vision into the health of the system from their perspective. When users attempt to use a "broken" system, they may waste time and resources attempting to perform their own sort of troubleshooting. All end users recognize that services go down from time to time. But what end users desire is proactive notification that tells them about system status and when they can expect the system to return to service. Chapter 7 includes metrics of value here as well:
- Scheduled Outages. When a BSM system is integrated with a notification system for scheduled outages, this enables end-users to get rich alerting. Consider the problem of being an end-user when this information is not available. When a scheduled outage causes the system to be unresponsive to the end-user, if they have no information about the timing of the outage, they are forced to re-attempt entry at regular intervals until the system is again responsive. This involves a time cost for the end-user. By providing them with a notification that shows when the system can be expected to be again available, they can attend to other tasks until the expected return-to-service time.
- Outage Notification. Outage notifications are similar in concept to the metric above, but also include unscheduled outages. Similar to the problem outlined above, when a business system experiences an unscheduled outage due to a problem, being able to provide users with a notification about the problem lets them determine their next course of action. Ultimately, providing more information of this type to the user means greater user satisfaction during non-nominal periods.
- Infrastructure Status. When simple outage notifications are augmented with additional data regarding individual components of the business system, this status information can also be of value. Providing information about individual system status helps more technical users with better explanations about the activities they're seeing currently onsystem.
Achieving IT Value
The information discussed in Chapter 7 on operations then threads into Chapter 8's specific focus on the value to IT. In Chapter 8, we start with a discussion of how five sources of IT data assist in feeding information to BSM's calculations engine with the goal of generating the kinds of metrics discussed earlier. These sources of data include service desk data, configuration data, response time data, infrastructure metrics data, and business data.
In many IT environments, much of this data is already being collected through one of many management and monitoring tools already present within the environment. BSM's instrumentation hooks into these disparate systems to enable the data from theses systems to augment the BSM solution's own internal EUE monitoring.
The combination of these data sources is what ultimately enables IT to use the service model as a troubleshooting tool. Chapter 8 includes two images associated with an example service model and how a problem at the lowest level of that model immediately begins affecting dependent services within the model. IT administrators can make use of flow-down and flow-up analyses of the service model to see directly how a root cause impacts service behavior and performance.

Figure 10.11: With BSM, a larger problem can be drilled down into its disparate components for low-level troubleshooting.
In the example reproduced here as Figure 10.11, you can get an idea how the overall problem associated with Transaction Performance drills down into deeper and deeper levels of information. In this example, when Transaction Performance doesn't meet its desired threshold, the drill-down shows nominal performance directly with both the front-end and database, but a performance problem between these two services. Drilling further into this performance problem, we find that a router has too high of an error rate and thus its performance is too low.
Most specifically, this information is useful because it enables IT to best assign available resources towards the problems with the highest impact. When multiple problems occur—a situation that occurs regularly in IT environments—those that have that highest potential impact to users can be assigned the most attention.
BSM and ITIL and Six Sigma
Having a high level of situational awareness of an environment is only useful if that information is used to improve the environment. BSM links specifically into two IT frameworks for processing and decision making: ITIL and Six Sigma.
Chapter 9 includes a short explanation of the five stages of ITIL as well as the 24 activities commonly undertaken within each stage. ITIL is designed to assist with the process of taking a new IT service from its initial strategizing, through design and transition, on to full operations. Wrapping each of these first four stages is a common thread of continual improvement used to identify and fix areas of gap in the design, implementation, and operations processes. BSM's concepts and capabilities are designed to align with only a subset of the activities commonly considered during each of these stages. Figure 10.12 shows an example of the specific activities that can gain assistance through BSM.
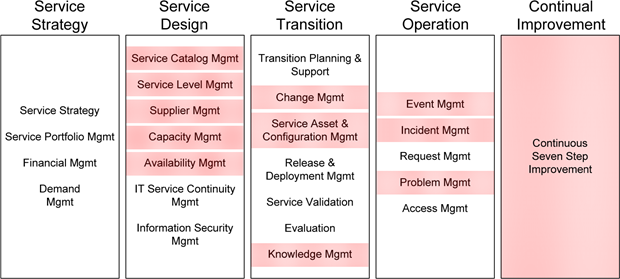
Figure 10.12: BSM aligns with a subset of ITIL's activities.
Chapter 9 goes on to explain these areas and the specific tie-in's to a BSM implementation. We learn there how BSM's information assists with the management of these tasks:
- The service catalog is a graphical representation of the services as defined by ITIL.
- BSM's tie into service availability feeds metrics into service level management while providing data for capacity and availability measurements.
- Supplier relationships with special consideration towards supplier SLAs can be tightly enforced through BSM data.
- Change, knowledge, and service asset and configuration documentation gain enlightenment through BSM's aggregation of federated change and asset management databases.
- Events, incidents, and problems are all resolved much more quickly through EUE monitoring and its built-in root cause analysis visualizations.
- The entire continual improvement stage is augmented through real-time and highly granular visualizations that show quantitatively how the system is impacted through improvements.
Whereas ITIL is intended to be a set of best practices for all phases of a service introduction, delivery, and operations, the Six Sigma framework highlights just the processes associated with continual improvement. Six Sigma utilizes a number of quantitative measurements and tools to assist with identifying processes and the level of error that can or is being experienced during the running of that process. The goal with Six Sigma is to reduce the level of error (or "sigma") to an acceptable level (which can be up to six "sigmas" from the norm).
Where Six Sigma and BSM align well is in Six Sigma's data-driven approach to problem solving. With Six Sigma, numerous visualizations are used as mechanisms for identifying when process errors occur. Those visualizations can be easily generated through BSM's dashboards. Common visualizations include, among others:
- Control Charts, which model process behavior over time
- Process Sigma Value, which show the level of error being experienced over time
- Pareto Charts, which detail the kinds of process errors with an eye towards fixing those that have the greatest impact and lowest cost-to-benefit ratio
- Breach Charts, which identify when service elements are experiencing behaviors that are out of desired norms
In the same way BSM visualizations bring visible guidance to management towards the results of their decisions, these same tools are useful in process improvement activities for helping with structured analysis.
Reinforcing Value in BSM
This guide is intended to assist you with gaining an understanding of the inner workings as well as the value of the BSM methodology for management and monitoring of business services. Throughout this guide, we've used examples and imagery to assist with the learning process. But BSM is more than just a methodology or a framework. It also encompasses a software package that enables the concepts we've discussed here.
If you haven't yet implemented BSM in your organization, the process to identify and acquire the BSM software package that best suits you will be your next step. This guide is intended to provide a bar by which effective BSM solutions can be measured as well as assist in guiding you to the solution that works best for you.
Considering the valuation modeling intrinsic to any BSM solution, you're likely upon installation to very quickly start finding places where BSM directly benefits your business' bottom line. BSM is above all a tool used to discover and report on value, which means using it for self-discovery and self-valuation is a simple task. Good luck and best wishes with the infusion of BSM into your corporate culture. As the author of this book, and one of BSM's biggest fans, I hope you find great value and direct benefit out of its inclusion.