Achieving Management Value
Its 2:23p on a Thursday afternoon, a little more than 2 months after Dan's last call with Joe Gear of Glass Emporium, one of his biggest clients. It's a perfectly uneventful day in what seems like a string of them over the past month. Dan's mobile device sits quietly on his desk. Right next to it also sits the new monitor John had installed about a month ago.
It's not so much that the monitor itself is new, even though it is. It's a little bigger than the old one. The screen seems a little brighter, and Dan thinks it does a better job of working with the "executive" look he's been building for his office. What's really important about that monitor isn't its size or what it looks like. What's important is the data that it shows Dan.
You see, Dan used to have a monitor on his desk, quite a lot like this one. It was around the same shape and size, maybe a little bigger actually. That monitor gave Dan a heads-up display about all sorts of elements on the network. He could see when network devices went down or when they showed too many Dropped Frames. He could learn the Processor Queue Length being experienced by his servers. He could even drill down into specific problems to find out the status in relation to their resolution.
But there was a problem with that monitor. He didn't know a Processor Queue Length from a hole in the wall. And there was that embarrassing incident when he called into the Help desk demanding to know who dropped the frames, and whether the devices directly below that one would be impacted. He still chuckles a bit when he thinks about that poor Help desk person. The kid slowly explained to him that dropped frames were a network problem and they didn't have anything to do with calling in the Facilities department.
This new monitor Dan likes a lot. Rather than showing him a bunch of information that only the kids in IT knew and cared about, this one shows him things that he has the ability to act upon. It shows him a set of graphs that represent the number of people currently making use of FCG's online system. It shows him some nice dials that point to the right when his services are available to users. They point menacingly to the left when the system is having problems. He can see in real-time the number of users currently experiencing a delay in completing their transactions, a problem that Joe was very concerned about in that painful call 2 months ago. For any of these metrics, he gets an estimated dollar impact to revenue associated with every problem that appears. Those numbers he understands.
Best of all, he can click on any of those charts to delve deeper. If his dial that shows service availability—the one he looks at the most—moves to the left, he can click on it to drill down into why that dial shifted leftward. That second-level information is fairly understandable too, but too many clicks down into the detailed information gets his head swimming like it did with his old monitor. The information is there if he needs it. Usually he doesn't.
As he's pondering a shift in one of those needles, the phone on his desk rings. Picking it up, he finds his buddy and customer Joe on the other line. They'd finally gotten around to that golf game last week, and Dan figured Joe was calling to gloat about his unbelievable shot on the 16th.
"Hey, Dan," Joe starts, "How's that short game of yours coming along?"
"Just as good as it was the other day," responds Dan. He let him win last week, or at least that's what he keeps telling himself, "Or as bad, if you're calling to gloat."
Joe laughs, "Not at all! Actually I was here to talk a little about that Web site of yours again. I've been getting some more reports from my people down on the first floor."
A shiver goes up Dan's spike, but just for a moment. "Not again," he thinks as his eyes shift to his monitor and its dials, all of which are pointing in the right direction, "I trust your people are having a good experience with it? We've been putting in a bunch of new equipment designed specifically to help us understand when you guys are having slowdowns or other problems."
"Actually, that's the reason why I'm calling," Joe continues, "Our guys are reporting great responses in the past month. I just got out of our monthly tag-up meeting with the people down in purchasing, and they asked me specifically to thank you and your team for whatever you've done over the past month. Our productivity down there is up 20%."
"Well thanks. After that phone call a couple of months ago, we made it our first priority to figure out what was causing the problem and get it resolved," Dan explains, "In fact, we went quite a bit further than that. We found out that the things we were watching for weren't really telling the true story of what you guys were experiencing. So, we implemented some new technology that helps us understand your experience a little better."
"Interesting…" Joe's voice trails off for a second. He continues, "Well, that's the other reason behind my call. They've been raving so much about the changes over a short period of time. I'm here to pick your brain as to what we could do with our own Web sites."
Dan beams, "Well, let me tell you about this new stuff. First of all, you've got to see this new monitor on my desk…"
Obtaining and Maintaining Value in a BSM Implementation
Thus far in this guide, we've discussed topics associated with device and application monitoring. We've talked about how monitoring for deviations in behavior across the network can manifest into reductions in the overall quality of business services. At their most elemental, those deviations can come in the form of devices going down. When devices go down in a business system, that system loses the ability to perform some or all of its functionality.
In our last chapter, we elevated that conversation away from individual devices and their up/down status. There, we talked about how loss of a system subcomponent is really the easy part. Understanding how a reduction in the service quality of a subcomponent impacts the system as a whole is much more critical to the overall health of the business service. This is because finding and measuring those reductions in quality are difficult without proper toolsets in place.
Whole system counters are the immature IT organization's only barometer towards measuring the health of its services. But, as discussed in Chapter 5, whole system counters provide an incomplete picture at best. Because business services often involve the intercommunication between multiple systems in a thread, slowdowns and loss of services can be experienced by end users that don't involve a noticeable change to whole system counters. As an example, if a coding error in an application causes an application to regularly enter an inappropriate wait state, that situation will not show up as a noticeable change in a whole system counter. As we learned in Chapter 5, the only way to truly understand the experience of the user is to measure from the perspective of the user.

Figure 6.1: This and the next two chapters will discuss the achievement of value along three axes associated with the implementation and use of a BSM solution.
To this point we've been looking at the technical aspects of Business Service Management, and its complement that is End-User Experience monitoring. We've talked about the technical and process-based aspects of implementing such a system to the benefit of the organization. This chapter as well as the next two chapters will deviate from those discussions a bit to consider the value returned back to the business by implementing such a system.
In this chapter we'll discuss the value associated with managing business systems. Here, we'll talk about the potential return that can be obtained by enterprises, outsourcers, and end users themselves. We'll show some examples of management dashboards that enable that return, and how the information gained through those dashboards improve business leaders' ability to better service their customers.
In the following two chapters we'll continue the conversation on value, delving into the achievement of operational and IT value. In Chapter 7, we'll focus on how BSM's information can reduce operational expenditures to an organization. We'll also talk about how BSM can be a management umbrella, under which management controls can be housed. There, we'll revisit the topic of dashboards, discussing best practices in building effective ones.
Chapter 8 will conclude our conversation on value, focusing our discussion back onto IT. Business leaders like Dan in our chapter example gain higher quality information through a fully-realized BSM solution. But IT gains as well. IT gets the incorporation of a toolset that assists service desks with problem identification, administrators and developers with resolution, and IT managers with data that drives and justifies future purchases. In that chapter we'll talk about the connectors available to many BSM solutions. These connectors enable BSM to plug into various applications and frameworks.
Let's focus our discussion now on obtaining and ultimately maintaining value in the implementation and use of a BSM system. That value comes from a set of potential drivers, which benefit deployments in enterprises, with outsourcers and solution providers, as well as value to the customers of a system.
Obtaining Value
We first need to break down the value obtained by an organization into two sets of categories. First, there are some elements of value that arrive through the implementation of BSM. Others arrive through the use of that fully-realized solution. As you can see through our chapter example above, Dan's new monitor arrives along with a whole new set of data. Though the monitor is new, the data that comes with it has been reformatted such that it is now much easier to digest. His previous vision included a set of data that had value, though not to him. That information was useful to the developers who code as well as the administrators who maintain the system.
The information his new monitor shows him originates from End-User Experience monitoring agents that are looking at individual transactions between users of the system and the system itself. Those EUE agents are also looking at the transactions between subcomponents of his B2B system. When those transactions drop below set thresholds, his dial moves to the left. When transactions remain within desired levels of performance, his dials stay firmly on the right. His use of the system means that he has a persistent heads-up display that provides him with a vision of the overall health of the network.
When his system begins experiencing problems that would affect his customers' experiences, he can be proactive and communicate with them immediately. He can maintain critical business relationships as problems occur rather than after they've lingered for a period of time. This advance information prevents calls such as the one he experienced in our last chapter where his customers are forced to notify him when problems occur.
This brings us to the second set of categories by which value can be obtained. There are both tangible and intangible benefits associated with BSM. The tangible benefits align with an improved capability to see where problem spots are within the system and resolve them. The speed in which those problems can be resolved is a direct and tangible impact. The enhanced situational awareness Dan gains through his monitor feeds into the intangible benefits of the system. Dan's ability to maintain relationships with his customers is affected through that capability and can be considered an intangible benefit.
Table 6.1 lists a few more of the benefits an organization can obtain through BSM. These benefits are broken down by category:
| BSM Implementation | BSM Use | |
| Tangible Benefits |
|
|
| Intangible Benefits |
|
|
Table 6.1: A non-exhaustive list of value gained by an organization through the implementation of BSM. That value is broken down into various categories.
Maintaining Value
Obtaining that value is one component, but maintaining it over time is yet another. One component of a fully-recognized BSM implementation that complements this has to do with the metrics provided by the system itself. What we mean by this is that the job of a BSM system is to provide metrics validating the health of systems and the quality of services. Those same metrics can be used to simultaneously validate the value of the BSM system itself.
More than anything, BSM is a tool to crunch complex monitoring data. Thus, a snapshot of system metrics prior to its implementation can be compared with future snapshots to validate the value it provides.
Let's look at some examples of how this is the case. Recognizing value over time for a BSM system involves the continued measurement of that value. A BSM implementation does that through a series of metrics, the most relevant of which is called the Cost of Poor Quality (COPQ). This metric, which we first talked about in Chapter 3, measures the quantity of lost or deprecated transactions that occur over a period of time. When an Average Revenue per Transaction metric is related to that measurement, this provides an overall understanding of the total revenue opportunity lost over that unit of time.
This metric can be an excellent starting position from which to determine how a system that fails to meet desired specifications impacts the business. When BSM gathers this metric, it is then related to the amount of business being lost associated with poor quality. That data as it changes over time provides an excellent measurement of how well a BSM system is impacting a business' ultimate bottom.
Also useful is the nature of BSM's collection and calculation mechanisms itself. Once in production a BSM system is unlike other management systems in that it automatically begins creating metrics associated with its own value. This occurs naturally as a part of BSM's calculations of revenue impact. As it goes through its calculations over time identifying and categorizing system characteristics, it concurrently calculates value measurements of its own worth.
By monitoring these metrics over time, an organization can track the improvement of their managed services related to BSM's involvement. Some metrics that assist in this validation include:
- Problem time to resolution
- Number of unsuccessful transactions per day (historical)
- Frequency of an unsuccessful transaction per unit of time (historical)
- Target IT transaction improvement & Rate to target
- Unsuccessful transactions per unit of time after resolution
- Total minutes elapsed in processing transactions (historical)
Each of these metrics can be used concurrently in measuring the quality of the identified business service along with determining the value of the system itself. As an example, if the metric for Problem time to resolution decreases over time after the implementation of BSM, it can be argued that BSM's data assisted with the resolution of those problems. To further validate that assessment, one can align that metric with others such as Number of unsuccessful transactions per day (historical) or Rate to target IT transaction improvement. Combining these metrics further justifies the rationalization that BSM is improving that business services' capability to serve customers.
Calculating ROI
Specific Return on Investment data can be challenging to calculate. So, this section will not attempt to build complex calculations based on cost and anticipated benefit. Instead, in this section we'll review some of the cost and benefit metrics that can be merged together to illuminate potential investment return. In order to calculate a proper ROI, three elements are necessary that merge together to provide a complete picture. Those three generic elements are the cost to implement, the anticipated cost savings associated with the addition of the new technology, and the revenue benefits expected with its use. In the sections below, we'll discuss each of these in turn.

Figure 6.2: Adding together the cost savings benefits with the revenue benefits and subtracting the cost to implement gives a good representation of a BSM implementation's ROI.
Cost to Implement
Implementation costs for a BSM system relate in many ways to the cost of the software itself. That cost includes the evaluation process, its installation, consulting and training services needed to properly train internal staff on its operation, and hardware resources.
Of the three metrics that make up our ROI, those that relate to the cost to implement can be considered the easiest to measure. They involve hard dollar expenditures needed to find the bestfit BSM system and bring it in the door for the company. In addition to the elements noted above, it is important when considering these numbers should be recurring costs associated with:
- Software maintenance. A good rule of thumb for the costs associated with software maintenance is 18% of the initial purchase price. That estimate typically runs across multiple vendors as the expected amount of annual expenditure necessary to keep the software under maintenance.
- Technical support. Depending on the vendor, additional costs may be required for technical support. An important contractual element that should be considered when making a purchase is involved with the inclusion of technical support as a component of annual maintenance costs.
- Hardware refresh. BSM systems are intended to be long-lasting solutions. Thus, a proper ROI should additionally include hardware refresh costs at intervals, usually three or five years. This ensures that as technology changes, hardware is regularly purchased to keep up.
Cost Savings Associated with Implementation
Cost savings associated with a BSM implementation are usually related to the savings associated with improvements in application-related problems. BSM enhances troubleshooting and resolution activities through its deep monitoring into business systems. Thus, when those systems incur problems, technicians and administrators have an improved suite of tools to bring them to resolution. The rate of that resolution is an excellent metric to be used in an ROI calculation. Some additional metrics that relate to or feed into this metric include:
- Target problem reduction. This is the anticipated reduction in time-to-resolve for problems with BSM-monitored systems. Conservative estimates here are useful in estimating not only the amount of time saved in solving problems but also a reduction in the number of service breaches per unit of time.
- Service desk load. Concurrent with the reduction in problems is a reduction in case load to the service desk. By reducing issues that have risen to visibility by users, they are less likely to need the services of the service desk. With mature organizations knowing their metrics for the cost associated with each service desk ticket, reductions in load can be directly related.
Another potential metric relates to the burden of systems management tools operational within the environment. When the functionality of systems management tools can be aggregated, the number of redundant tools in the environment can be reduced.
For many management tools, the highest cost of ownership relates to client management, or the activities associated with managing clients on-system. When those tools can be reduced through the implementation of a BSM system, this incurs a cost savings to the organization.
Revenue Benefits
Revenue benefits associated with the implementation of a BSM system typically relate to the quality of transactions within the monitored system. When transaction quality can be measured and compared historically, this provides a basis by which added revenue realization can be made. Improved transaction quality directly relates to the overall quality of the service itself. Below are some metrics used in the calculation of that quality:
- Average revenue per successful transaction. This metric is the basis for many of the calculations recognized in this section. When revenue can be related per transaction, this gives us the bar by which revenue loss or gain can be related through improved transaction quality.
- Number of unsuccessful transactions per day. This metric is doubly useful during the implementation of a BSM system. Prior to the EUE monitoring that arrives with a fullyrealized BSM solution, it can be operationally challenging to measure the number of lost transactions. When that monitoring is enabled, the organization gets a first look at how many transactions are actually being lost. This first look can then be compared with others over time as BSM drives improvements to the business service.
- Average time per transaction. This metric can be the primary measurement of transaction quality when not related to a failure. The time elapsed to complete a transaction bears directly into the user's ability to complete that transaction. When users are unable to complete transactions within an appropriate amount of time, they may leave the system rather than complete the transaction.
- Total minutes used processing successful/unsuccessful transactions. This metric relates to a period of time where a count of minutes used in processing either completed or noncompleted transactions occurs. Non-completed transactions are a waste of system resources, doubly so as unsuccessful transactions often must be rolled back out of the system. Between these two metrics, a shift in time from unsuccessful to successful transactions relates to a more efficient use of available system resources.
- User drop rate. Related to the above, when users grow frustrated with an un-optimized system, they will eventually "give up" on their interface with it. BSM enhances revenue when improvement activities related to its information reduce this metric.
It is helpful when calculating the ROI associated with these numbers to include a target improvement rate associated with the BSM implementation. This target rate is the desired level of improvement the organization wishes to achieve by implementing the system. When creating the ROI calculations, it is helpful to use the target improvement rate as a lever for visualizing how its change relates to a change in overall return.
Management Visibility
Getting the most management value out of a BSM implementation also relates to the information that system can provide. The information collected through traditional device and EUE monitoring is only as good as its presentation to its consumers. Considering this, it is critical that good dashboards be built that are suitable to the individuals that require their information. As we discussed back in Chapter 1, "one of BSM's central tenets involves the digestibility of the information provided."
In the following sections, we'll discuss how management visibility is obtained through the implementation of effective dashboards.
The dashboards shown in the remainder of this chapter are intended to be used as examples of how dashboards can be configured. Depending on the BSM solution chosen, dashboards may look different or use different widgets to display data. Those used in the following sections show a broad sample of how dashboards from any BSM solution can be used.
Visibility & Dashboards
Back in Chapter 1 we talked in generalities that once the service model was fully realized and configured into the interface, and once appropriate agents are installed around the network, the final task is the creation of dashboards that provide information specifically tailored for their users. Through the remainder of this chapter and into the next, we'll dive deep into the dashboard creation process. In the following sections, we'll show some examples of dashboards for use by executives, the IT department, and even with end users. To the customers of a BSM system, information contained within dashboards can be customized to their needs. So an outsourcer will prefer contract fulfillment information, while enterprise IT will likely want device status information.
The beauty of BSM is in its rich calculation engines that enable data to be factored in any way necessary. The limitation is only on the designer's skill in pulling and formatting the information in the way that best suits its consumer.

Figure 6.3: An example of an IT management dashboard for a financial institution that shows system status as well as business metrics(credit card transactions, costs).
What to Display
The hardest part in designing good dashboards is finding the best-fit quantity of data to include as part of its main page. Dashboards typically run within an Internet browser window such as Internet Explorer or Mozilla Firefox. So ensuring that dashboards are sized in a way that works with those browsers is also critical.
Figure 6.3 shows an example of a dashboard of interest to a financial institution. This dashboard is specifically tuned towards the executives of that institution. Here, EUE agents are looking at transactions across multiple sites and aggregating that information into a single view. The executive gains a single-screen view of the health of the environment, while at the same time getting financial information that relates to the health of transactions going through that system.
You'll immediately see that most of the information in Figure 6.3 is graphically related. The screen can be considered relatively "busy", as it is full of information. However, the graphic nature of the information makes it easy for the consumer to follow over time. Important in creating dashboards is finding the correct elements of information, and presenting them in a way that the eye naturally is attracted towards information of interest. Green is a color typically used to show health while red is a color used to show unhealthy elements. In the same vein, upward trending data typically indicates improving health and revenue while downward trending data indicates declining health and revenue.
The incorporation of widgets such as dials, heat charts, spread charts, and maps along with color coding further helps the dashboard consumer.
The goal with any dashboard is to create a picture whereby its consumer does not need to look closely to understand what is going on. Similar to how dashboards work in automobiles, its consumer should be able to merely glance at the screen and immediately recognize health or problems.
What Not to Display
Initial dashboards are meant not to be static instruments. Rather, they are intended to be the first layer in a series of data presentation screens provided to their consumer. If a consumer sees an element of concern within the dashboard, they should be able to click that element to drill down into additional and more detailed data.
That being said, it is critical not to overexpose information to the consumer at the top-most level. Any overuse of textual information reduces a top-level dashboard's efficacy. Related to BSM's tenet of digestibility, the information at that first layer should remain graphical whenever possible. Reading information involves a higher level of processing on the part of the consumer, and should be relegated to down-level views.
The content of the dashboard must similarly be relevant. As was discussed in our chapter example, Dan's first monitor included an incredibly rich interface showing which elements were up, which were down, and which were being worked upon. But none of this information was relevant to Dan's job as COO. This sort of information is better suited to John the IT Director rather than Dan. Dan is much more interested in financial information like what is shown in Figure 6.3 with a minor representation of service health such as what is displayed on the centerright of that image.
Access Control
Securing the information presented within the dashboard is as critical as securing the systems it monitors. Typical with business systems, information about transaction health, rate, or issues can be considered sensitive information, the disclosure of which could negatively impact the company. Thus, effective access control elements must be put into place so that individuals can see and work with the dashboards that relate to their jobs. But information that does not relate to them should likely be kept secured from their view.
As an example of this, service desk employees usually do not need access to real-time financial information. That data is useful to business analysts and executives. So it is a good idea to prevent service desk employees from seeing this information.
Trend & Reaction Lines
Figure 6.4 continues our discussion by showing another representation, this one an executive summary of various systems within an organization. Here, we also see additional widgets that display historical information associated with the business service. In Figure 6.4, we see that service quality over a period of time has trended to a down state. The current user impact associated with that outage is shown on the lower-right.
Reaction lines are visual elements that let the consumer know when a situation has progressed to the point where some action is required. It is possible using dashboard generation tools to graphically represent the points at which those situations occur. By creating reaction lines with a graphical representation, consumers do not need to monitor textual data for problems.
This dashboard can be an example of a first-level drill down screen. When problems occur, consumers want to know what they are related to. This dashboard in the upper-right shows metrics for SLA fulfillment as well as the trending of monthly quality. This dashboard can assist an executive with ascertaining when problems occur and the impact associated with those problems while not being deluged with the technical details associated with the problem.

Figure 6.4: This Executive Summary dashboard shows some trend lines based on user impact time and service quality. Reaction lines notify dashboard consumers when a problem has hit a critical state and some remedial action must be performed.
In Chapter 7, we'll review a comprehensive list of widgets that can be added into dashboards for various reasons. These widgets are configured such that data feeds their actual positioning. Some widgets work better in some situations than others. In Chapter 7, we'll talk about the best practices associated with their use and in building dashboards in general.
Management Control
In addition to providing visualizations of the business service environment, dashboards enable an improved sense of control. When management is empowered with information at their fingertips they are given the ability to make more informed decisions about their business. Depending on the need of the consumer, dashboards can be configured with data that enables the executive or business analyst with the powers to change the environment.

Figure 6.5: An example of a control dashboard, this operations details view shows detailed information about the state of various locations and business services. For each, more detailed information is provided, giving the consumer a specific view of what areas may require attention.
Control Dashboards
Control dashboards can exist at the top level or be configured as drill-down elements. The idea with control dashboards is to provide enough information to their consumers (for example, IT and executive management) that they can make effective decisions regarding the operation of the environment. Good control dashboards also help with augmentation decisions. As environments grow they inevitably require purchases and upgrades to support the needs of their users. By enabling the consumer with information regarding performance, activities, and behaviors, the consumer can enact change to the environment as necessary.
Figure 6.6 shows an example of a second-level dashboard that presents more detailed information about multiple business services over a spread of multiple locations. Service quality for any particular service is listed in the dials in the center, while history and business calendar information is presented in the upper-left. Important here is the inclusion of textual explanations of situations occurring within each business service and/or location.
The presentation of this information provides its consumer a more holistic view of the details associated with a failure condition. This enables them to make better decisions in terms of problem resolution or customer relationship development.
What to Display
These types of dashboards typically include Key Performance Indicators (KPIs) that show the health of services within the network. Whereas top-level visualizations are best served using allgraphical representations, lower levels require the addition of textual information that validates the images at the top level.
The typical consumer use case with these sorts of dashboards becomes involved when business services go out of specifications. When thresholds are breached, the top-level dashboard will elevate an indicator showing the situation. At best, a dashboard's users need only a single glance to recognize problems, and start working toward their solutions. The consumer than can be given the ability to drill down into that problem to see its cause, information about its resolution, and any impacts that are occurring.
What Not to Display
Important here to realize is that the same drill-down linkages that occur from top-level to secondary-level dashboards need not stop with the first level. At the point of secondary control, the dashboard designer should often remand highly specific data to a third-level dashboard. This allows the same dashboard to service multiple classes of users. Those with the technical experience to understand and action upon specifics can drill down to third-level information. Those without the experience or the job-related responsibilities can remain at the level of detail of use to them.
Management Impact on Operations
The elevation of information to the level of business management provides transparency between business management and IT operations. In organizations with technical components, business leaders often suffer from a technology gap, where their experience with business concepts don't align with the level of technology being used in service of their customers. This gap in knowledge and experience can be especially problematic when executives are unaware of the activities within their business' technical employee base. They may make decisions that don't make sense from a technical perspective.
By enabling a reconfiguration of traditionally technical information into revenue targets and rates understandable by the non-technical executive, this goes far in aligning the goals of IT and the business. That alignment is a central tenet of Business Service Management.
SLA Measurement & Fulfillment
One specific type of dashboard useful for both management and IT is associated with Service Level Agreement measurement and fulfillment. Back in Chapter 2 we talked about how immature IT organizations have a tendency to set SLAs that relate only to individual device health rather than the overall status of the business system. Immature IT organizations also tend to set SLAs that are complicated or operationally unfeasible to quantitatively measure.
BSM's data gathering and calculation tools allow for SLAs to be assigned to IT and outside organizations that are measurable. Most specifically, BSM allows for real-time collection of data. When SLA counters can be collected and reported on in real-time, this allows for a much better recognition of fulfillment.

Figure 6.6: A dashboard widget, showing SLA measurements and their targets.
Consider the situation where an immature IT organization has laid SLAs in place with the business. When those SLAs are only measured at month's end or at the end of each quarter, it is operationally challenging for IT to meet their goals. When goals are not met, long periods of time must elapse between measurements. This inability for IT to see their status in relation to their goals makes difficult the process of meeting those goals. It is impossible to see how the efficacy of individual activities relates to the improved or worsened accomplishment of that goal. Only by providing regular updates through interfaces like dashboards can the completion of remediation activities be easily related to the ultimate goal.
Figure 6.6 shows a representation of a dashboard widget that shows four specific SLAs and the SLAs associated with each. These SLAs relate to availability targets, and as is shown by the example three of the four goals have not been met for the period. The visualization shown in this widget provides IT with a real-time rather than a monthly or quarterly measurement of its success or failure in meeting its required SLA goals.
Purchase / Upgrade Decisions
Another useful tool that is enabled through the incorporation of dashboards and visualizations is the ability to see how assets are performing in relation to the goals of business. The value of assets in terms of their net return back to the company is a challenging calculation when completed using manual tools. Conversely, when automated systems are in place that constantly measure individual assets, it is easier to see their relation.
One way BSM augments purchase and upgrade decisions is through views into the health of various assets within the system. In Figure 6.7, we see a dashboard widget specifically tuned towards failure rates of particular systems. Drilling down into these failure rates can provide additional information about the individual assets that make up that system. Mean Time to Restore and Mean Time Between Failure metrics are shown on the left. The Pareto Chart on the right shows failure locations by quantity and percentage. This illustrates that the top problem causes that are impacting the services come from IT or it can be read as "20% of the root causes are impacting 80% of the overall business service." This helps practitioners prioritize improvement where impact is the greatest—in this case, IT.

Figure 6.7: Dashboards can also be used to show the utility and failure rates of assets. This information provides insight into the need for future purchases or upgrades.
These metrics dovetail into those discussed above relating to transaction health. When transaction health can be related to the inability for assets to keep up with the load, this is a key indicator that additional purchases may be necessary. This quantitative information in the hands of management helps justify new purchases. It can reduce the cycle time associated with purchase requests, as purchases are made when they are required.
Even more useful, when predictive analyses are made against existing transaction and health trend lines, it is possible for managers to begin the procurement process before failure situations occur. As asset procurement lead times can be extended, predicting the need for additional assets before they are required allows for graceful scaling of existing services without costly downtime associated with overuse.
Process Integration
Each of the above topics relates to the iterative improvement processes that are enabled through the visualization of necessary information. Immature IT environments exist in that mode primarily due to the lack of information at their fingertips that shows them where bottlenecks and other problems exist within their environments.
Process improvement frameworks such as Six Sigma and ITIL assist with this activity. But alone, these are frameworks little more than instruction sets. Data is required to make correct improvement actions within an environment. That data can come from the elements and transactions monitored through an EUE and/or BSM system.
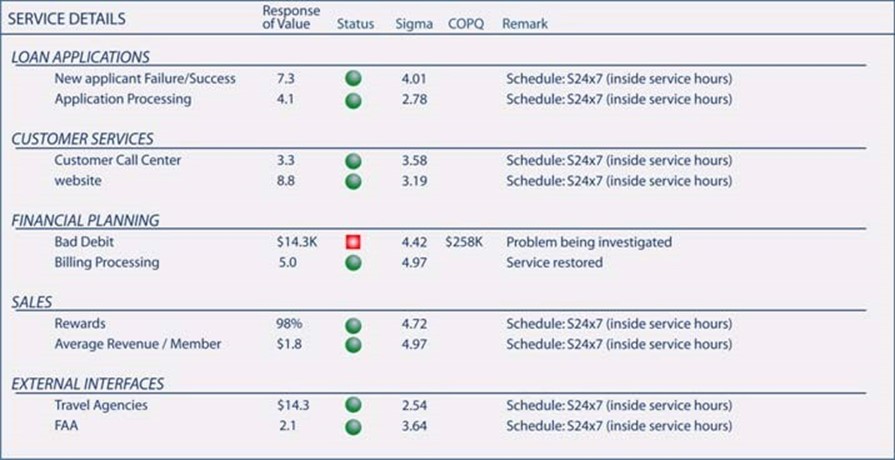
Figure 6.8: A dashboard widget showing individual business services and their level of deviation from thresholds. This information can be used along with process improvement frameworks like 6 Sigma or ITIL in improving technical and personnel processes.
Figure 6.8 shows an example of how data can feed into a process improvement framework such as Six Sigma. In this example, the dashboard shows the status of individual business services and major components of those business services. For each of these, a sigma is valuated to the service. That sigma relates to the amount of deviation from desired values is present within the system.
When the level of sigma for transaction performance goes beyond established thresholds, as is the case with the Bad Debit subsystem of the Financial Planning service, a Cost of Poor Quality value is assigned. In this case, the cost associated with going out of specifications is $258K. This heads-up display provides process engineers and business analysts a view into the transactions within a system, and helps them identify where deviation impacts corporate revenue.
Fitting BSM into the Overall Operational Scheme
Alone and without attention, any of these dashboards provides little value to the organization. If the data they provide is not watched and used on a constant basis, dashboards are little more than pretty pictures. BSM is a tool that provides information to consumers that allows them to make better business decisions. Fitting BSM into the overall operational scheme requires the incorporation of procedures so that key personnel are monitoring and know what actions to take when problems occur.
In addition to this Pavlovian approach when "red lights" appear on screen, it is similarly critical for business analysts and process analysts to make use of this data. These individuals can analyze data within the context of existing business activities to provide additional insight into business activities. As was explained in Chapter 4 when we discussed the team members necessary for a BSM implementation, those same analysts over time will find additional ways in which BSM's data can benefit the organization.
End User Visibility & Control
Individuals within management are not the only consumers of dashboard information. Others within and without the organization can similarly make use of the information gathered by a BSM solution. In the next few sections, we'll discuss three classes of users that also gain from the implementation of a BSM system.
The first of these are end-users themselves. These individuals are the ultimate consumers of our systems. They can be classified into two different groups:
- Technical. Technical end-users often are those that still exist within the organization, but are users of the business systems under management. These "insider" personnel often have a high requirement for transaction information in order to perform their jobs. Transaction information can be factored in ways that enables them to see trends in use and environment states.
- Non-technical (business users). Non-technical end-users are often those completely outside the organization. They may be customers of the company or individuals who make use of the data provided by that company.
As an example of each of these, think first of a large mortgage brokerage. The consumer of their loan origination system is likely highly technical. They likely will want rich information about the status of mortgage metrics, their location, their processing status, and information about the industry as a whole.
Conversely, an example of a non-technical individual can be the customer of an external B2C system. If an individual wants to purchase products from a company's web site, they don't require industry and trending data. But they may want information about the status of that web site. The scope of data they require is less than in the example of the mortgage broker. To them, simple status information involving their individual order and the status of the web site is what is useful.

Figure 6.9 An end-user dashboard for a technical consumer. This visualization aggregates end-user transaction data for an example government system.
System Status
As you can see in Figure 6.9, end-user consumers are predominantly interested in status information about the services they consume. The visualizations there show sample data associated with the level of repair of city elements, housing data, and rate payments. End users of this system in this example are less interested in the quality of transactions going through the system. Instead, they're interested in the transactions themselves.
One specific example of service quality that is of interest to end-users is the ultimate availability of the system in total. BSM solutions are better than static The System is Down screens for endusers because they can provide more accurate information about the status of the outage and the expected time for services to be returned. These types of data can be categorized into:
- Projected time to repair. When problems occur with a business system that impacts the end user, those users more than anything are interested in the quantity of time the system is going to be down. If a system they rely on for regular transactions goes down, knowing that it is expected to return in 60 minutes is more valuable to them than attempting to retry accessing the system over and over again until it returns.
- Automated incident information. Providing information to users about the scope of an outage is of particular value to the troubleshooting administrator. When systems go down or partially stop functioning, a natural next step by users is to repeat accessing that system until it returns. When many thousands of users hit Retry repeatedly, it causes an unnecessary stress on an already problematic system. By providing users with information about a system's return to service, they can go about other duties until that time has elapsed.
- Scheduled outages. Systems also typically have known outage windows. Those windows can occur during slow periods for one time zone, but the global nature of the Internet means that one time zone's slow period is the middle of the day for another. When businesses work globally, informing users of scheduled outages allows users to change their use patterns so they are not impacted by the outage.
Outsourcers & Service Providers
Outsourcers and service providers are another group of specialized users for BSM systems. They will make use of all the functions we've discussed up to this point with a fully-realized BSM solution and its visualizations. But they have an additional need associated with contract fulfillment that is a primary focus other groups do not have.
Within outsourcer relationships, budgets and costs are typically created with very narrow margins for error. When errors occur of even a small impact, this can negatively impact the overall contract between the outsourcer and their customer. Even a minor deviation can cause entire contracts to become loss situations for the outsourcer.
It is because of this nature of outsourcer contracts that BSM's data helps with reconfiguration of contract line items and workflow on the fly. Similar to how BSM's data helps IT organizations recognize the efficacy of their activities in relation to their SLA, outsourcers use BSM's data to validate the fulfillment of their contracts and remediate any breaches.


Figure 6.10: A dashboard widget that shows critical Operational Level Agreements and Underpinning Contracts for an outsourcer. This information helps the outsourcer adjust resources in real time as contract conditions change.
Cost & Risk Reduction
Outsourcer contracts are highly scrutinized as they are laid in place. Outsourcers are typically highly mature in their models of contract fulfillment, having highly-refined calculations in place to assist them with developing profitable contracts through very low margins. Of particular interest to outsourcers is the data used to fulfill those calculations. As outsourcer calculations are typically complex, the maintenance and regular updates of reports associated with those calculations can be unwieldy. Utilizing BSM's internal calculations and logic as well as its data collection capabilities with pre-existing management toolsets makes BSM solutions an easy implementation.
Contract Compliance
Along with the reduction of cost and risk in these relationships is the defined need to identify where breeches in contracts occur as well as the source of such breeches. Contract breech situations with outsourcers can be highly expensive, and relationships are often complex with outsourcer IT and customer IT co-mingling activities within the same environment. So recognizing the true root cause of a breech can assist the outsourcer with pointing the finger in the correct direction when problems occur. This ability to locate problem domains translates into a significant reduction in risk to the outsourcer.
Enterprise IT
Enterprise IT is yet another consumer of the information provided by BSM. Although much of our conversation to this point has to do with the movement away from a device-centric approach to monitoring, IT still has the job of care and feeding of individual devices and applications. As BSM's data collection tools have the ability to ride atop existing traditional device monitoring systems, the information gathered by those systems can be brought into BSM for IT consumption.
This setup has the advantage of unifying the tools employed by all branches of the organization to manage their business systems. Enterprise IT can make use of the same suite of visualization tools used by executives, application developers, and business analysts. This allows all groups to speak the same language and leverage the same toolset in identifying problems, finding solutions, and ultimately managing the environment.

Figure 6.11: An example BSM dashboard for business and IT executives illustrating each business function area for a bank e.g. Claims handling, telephone banking service, e-commerce etc. The traffic light colors show the quality performance for the services supporting these banking areas.
Cost & Risk Reduction
The integration of toolsets by all entities within the organization helps reduce the overall cost of support to the environment as measured in terms of redundant utilities. Also enhanced are the abilities for IT to work hand-in-hand with other organizational teams during augmentations or problem solving events. The ability for all teams to work together within a single interface means that many eyes are looking at the same data. This ultimately feeds into a data-driven corporate culture.
Customer Satisfaction
All of this relates back to the central tenet of BSM, which is improving customer satisfaction for systems under monitoring. When revenue is positively impacted through the incorporation of BSM's data and the subsequent analysis of that data, the management value associated with its use is validated.
BSM Enables an Ongoing Measurement of Management Value
This chapter has attempted to show how management value can be both obtained and maintained through the implementation of a BSM solution. We've talked about the potential return on an investment in a BSM solution. That ROI is related to the cost of the solution combined with the cost savings and revenue benefits it provides. We then continued that conversation by showing what can be considered the most important part of BSM – its data visualizations. Here, we've shown some sample visualizations and how those samples can be used by various consumers to drive their decisions. With each class of consumers, the level of data they require is different. BSM's calculating engine enables each class to see the data they require with the calculations they require.
Our next chapter will dig even deeper into these visualizations. There, we'll talk about achieving a post-implementation reduction in operational expenditures. We'll discuss how the incorporation of BSM can become an umbrella for managing all of an organization's business services. We'll then dive into the service model itself and how that model feeds each dashboard and its visualizations. We'll conclude with a talk about effective dashboards, how to build them, and the components available in BSM solutions today to make that happen.