Integrating BSM with ITIL and Six Sigma
"…and the last component as you can see on this slide incorporates the theme of 'continual improvement' with the process. Throughout this experiment, we've learned that the data we're getting out of the system gives us a much better situational awareness of the system itself as well as how our users interact with it.
"I've showed you to this point the data ingest process, the internal calculations, the integration with our financial models, and the ultimate presentation of dashboards that includes data of relevance to the user. The final question that you're probably thinking is, 'OK, now what do you do with all that information.' This data all feeds into what we call 'continual improvement.' With our data being integrated into established process frameworks such as ITIL and Six Sigma, our analysts as well as IT personnel can use it to identify gaps and areas where system improvements make operational sense.
"But there's a bonus here as well. As a benefit of our data granularity in combination with its real time relevance, we can very immediately see numerical results in relation to the changes we've made in the system. If we make a change and the data shows a benefit, then we've improved the system. Conversely, if we make a change and the numbers show a degradation in service quality, then we can very quickly correlate the two and back out the change. Essentially, by establishing good metrics and watching them over a period of time, we can continuously enact improvements to the system with a quantitative assurance that they're actually improvements.
"So wrapping all of this to a conclusion, with the right data being gathered and the right metrics in place, the job of our Business Service Management solution is to ultimately confirm that we're doing a good job. Thank you."
Dan walks off stage to a chorus of applause from the audience, all of his pre-speech nervousness melting away. "Man, that presentation went better than I thought…and the best part is that it's going to scare the heck out of our competitors," he giggles to himself as he steps down to answer some individual questions and shake a few hands.
Not quite 2 years ago, he never would have believed he'd be speaking in front of a group of his peers like this. After what he still considers one of the low points in his career with the loss of that "minor B2B system" so long ago, he's riding high on his later decision to bring more data visibility into his IT environment.
As people file out of the conference room, he looks in the back to see FCG's CEO Mike McWilliams sitting in the back row. "Now that's interesting. He wasn't supposed to be here," Dan thinks as he walks back to shake his boss' hand.
"Mike, what a nice surprise. Glad to see you here, though I'll admit I'm glad I didn't know until after the presentation. I was nervous enough already," Dan admits to the man who signs his paycheck.
"I had a feeling that would be the case," Mike grins, "but I was going to be in town anyway for other business and figured I'd sneak on over here to see how it turned out. Great job! You really killed them."
Dan beams. Even COO's get a warm fuzzy when they know they've done a job well, "What I didn't tell them was all the work we went through to get to this point. Getting that system inplace wasn't exactly difficult, but there was a goodly amount of work involved too. Getting our metrics and reports tailored to specifically what makes sense to us was in many ways the hard part. Once those were done, that's when we really started making widespread improvements that we knew would be successful."
"Well that's the other reason why I'm in town today," says Mike, "I just finished a morning meeting with Joe over at Glass Emporium. Seems they've appreciated the improvements too, because they just re-upped their agreement with us for another 2 years. That system of yours just paid for itself."
This is all new news to Dan, who's been away for a couple of days at this conference. "That's just great news," he says, "How about to celebrate, I'll let you buy me lunch."
BSM and Continual Quality Improvement
In this, our discussion of the basics, value, and utility of BSM, we've touched on many of the topics necessary for educating you on where and how BSM fits into your computing environment. In the past three chapters, we have focused specifically on three areas of value that BSM provides to management, operations, and IT.
In these past chapters, we've documented how dashboards and the data they provide enable management to make better decisions. We've illustrated the value to daily operations related to those dashboards and how good dashboard design brings visibility to otherwise complex data. Lastly, we drilled down into the technical IT elements that feed raw data into BSM's calculations engine. Figure 9.1 shows a representation of BSM in relation to those business-oriented inputs and outputs.

Figure 9.1: BSM provides reports and views to the business while ingesting expectations of service levels.
But all this talk about data, calculations, and visualizations only provides value to the organization that actually looks at that data. The best BSM system in the world adds no value to an organization if its members make no use of the information it provides. Making best use of BSM systems and technology is the central theme in this chapter. Within Chapter 9, we will talk about two frameworks for process and decision making into which BSM provides data.
Our first framework is the IT Information Library. ITIL is a framework of IT best practice guidance for the management of IT services. ITIL's suggestions discuss how IT organizations have over time come to bring their arms around the processes needed to best conceptualize, design, operate, and report on the success and/or failure of IT service management.
As you'll learn later on in this chapter, it is also recognized by ITIL that it is no longer sufficient to just deliver and support services. IT is required to continually adapt and improve its quality to meet the business' changing needs. ITIL introduces a Continual Service Improvement (CSI) stage which is also the final step of the best practice for quality improvement. CSI includes seven steps in this process but also leaves itself open for augmentation by other frameworks. One of these frameworks often used with BSM is Six Sigma. Six Sigma is a service improvement framework that, similar to ITIL's final stage, guides an organization through the steps necessary to identify and realize improvements to a service's quality. Today, BSM solutions often include Six Sigma because Six Sigma's framework includes a suite of necessary tools and techniques that assist with the visualization of data within the perspective of process improvement. In short, ITIL establishes processes and Six Sigma improves on them. As a result, the combined effort improves the quality of IT services delivered to the business.
Though this chapter is not intended to be a definitive guide to either framework, we will spend a number of pages talking about the generalities of both so that we can later put them into the perspective of BSM.
What Is ITIL?
ITIL is a set of industry best practices that was first published in Great Britain between 1989 and 1995 on behalf of the British Central Communications and Telecommunications Agency. Having gone through two updates since that time, ITIL v3 is comprised of six "books." Although the first book discusses the introduction to the framework, each of the other five books covers a stage in the IT service life cycle.

Figure 9.2: A graphical representation of the 24 activities and five stages of the ITIL life cycle.
As Figure 9.2 shows, ITIL is comprised of five stages and 24 processes within those stages. Each of the individual processes represents a codification of one common element typically required in order to design, build, transfer to operations, and maintain an IT service. Encompassing all these steps is a central theme of continual service improvement. As you'll see later in this chapter, one of the benefits of BSM is involved with the data it brings to many of these stages as well as how that data brings quantification to service quality levels that enables the business to make and measure improvements.
Six Sigma, as we'll discuss later in this chapter, is one general purpose quality improvement framework that can be used by IT in fulfilling the CSI needs of ITIL.
ITIL is not intended to be a set of governing practices for IT. Nor is it intended to be bylaws that IT organizations should follow. Rather it is a collection of best practices. It encompasses a set of ways organizations have discovered that tend to work best for the management of IT services. By incorporating some or all of these best practices into the daily operations of IT, organizations should expect to see higher levels of user satisfaction, better service availability, cost savings, better decision making, and faster time-to-market for IT services. These lofty goals come through the formalization of the various activities required by IT to support the computing infrastructure in support of business goals. Similar to the topics highlighted in Chapter 2, one major tenet of ITIL is aligning the goals of IT with the goals of the business.
Deconstructing ITIL v3
Although BSM doesn't directly impact all of ITIL's processes, the data it provides touches upon each in some way. Often, BSM's data can be used in support of necessary quantifiable measurements associated with each activity. Lacking these hard facts, the design and running of individual activities can be based purely on a subjective approach, which has a tendency to be based on best guesses and assumptions. The augmentation of these assumptions with data validates the end result associated with the activity.
Let's take a look at each of the stages in turn along with their associated activities. You'll see in this section that ITIL paints a broad brush across each of the functions associated with IT.
Service Strategy
Central to the composition of any organization's IT services is a strategy that ensures IT services are made available when needed, directed to the customers who need them, and implemented in ways that make sense to the business. ITIL's Service Strategy (see Figure 9.2) is that central component. Within this stage, IT works with the business to identify which IT services are needed by its customers and in what form. Specific design associated with those services is left to the next phase. Critical here is developing an understanding of the needs of potential and current users in relation to the goals of the business.
Presence of a central service strategy is a key indicator of a mature IT organization. Without such a strategy in place—along with the necessary research and customer understanding—IT finds itself building services for which there is no demand and expending effort and dollars towards activities that bring no value to the business.
ITIL's Service Strategy stage is predominantly focused on the supply and demand of services and service needs within the business and between the business and its end customers. By analyzing the economics of IT services, IT can best position existing resources towards designing and supporting those services best suited to the demands of its customers. ITIL's Service Strategy stage does this through three key activities:
- Financial Management—This activity concerns itself with the budgeting, accounting, and charging processes associated with IT services. Within this activity is the formal valuation of IT services as determined by their financial status.
- Service Portfolio Management—SPM is involved with the definition, analysis, approval, and chartering of the services with which IT is involved. SPM handles the overarching management of services in production as well as those currently under development.
- Demand Management—A highly interactive activity when service customers are involved, Demand Management looks at the will of the user and what they require from IT. This activity manages IT's high-level ability to fulfill the needs of its customers while aligning the services IT provides with those that customers want.
Service Design
Any IT service that is created in a vacuum of requirements will ultimately fail to fully realize the needs of its consumers. Thus, a coordinated approach towards identifying, documenting, and creating an IT system design that fulfills those requirements is necessary to building the best system. This is the central concept behind ITIL's Service Design stage. Here, IT designs solutions—to include architectures, processes, policies, and documentation—based on user requirements.
In this stage, IT builds the blueprint for the service to be developed along with the Service Level Agreements (SLAs) that define the success or failure of that service. IT resources are not an unlimited quantity, so negotiations with stakeholders to align available resources with needs are also part of this stage. This process ensures that the best possible service is developed using the correct level of personnel and financial resources. A large amount of documentation is generated in this stage with the end goal being the transition of the nascent service to full operations in the next. The Service Design stage includes seven activities:
Service Catalog Management (SCM)—The IT Service Catalog encompasses the list and descriptions of the services provided by IT. Managing that catalog ensures that the business has a correct representation of the areas of responsibility currently being claimed by IT itself. SCM's primary responsibility is to maintain a single source of information about these services as well as their descriptions and stakeholders.
- Service Level Management—The goal of service level management is to increase client satisfaction and the relationship by being able to proactively measure and report on service quality to meet the customers' needs. As we've discussed throughout this guide, service levels are formalized agreements between IT and its customers on the acceptable level of service IT can and will provide for those services in its catalog. Here is the measurement and fulfillment of those agreements through formalized monitoring processes.
- Capacity Management—Ensuring that a business service can support the needs of its customers during peak and non-peak times is the main purview of Capacity Management. This activity involves itself with the formal measurement of service capacity as well as the proactive validation that available resources can support user needs.
- Availability Management—This activity deals with issues surrounding the availability, reliability, maintainability, and serviceability of business services and service components. The information it deals with ties directly into the service level and the ability of the service to meet desired levels.
- IT Service Continuity Management (ITSCM)—Risk reduction and assurance of postincident operations are main components of ITSCM. ITSCM deals with the twin issues of disaster recovery and business continuity in support of the continued operations of the business and its critical services.
- Information Security Management—This activity deals with the technical and organizational issues associated with data security and compliance to applicable industry and government rules and regulations. ISM is responsible for the availability, confidentiality, integrity, and authenticity of business data itself.
- Supplier Management—IT requires the use of suppliers to provide the raw materials with which to build services. The management of relationships with those suppliers and the products they provide is the job of Supplier Management. Also important here is the valuation of goods and services provided by suppliers in relation to the money spent.
Service Transition
Once a new business service has completed its initial design and build, it is ready to be handed off to IT operations. In environments that do not use formalized processes for this hand-off, this activity can be a risky venture. The individuals who design a business service are often not the same group who manage its daily operations once it has moved into operational use. Thus, ITIL provides a set of formal best practices associated with this key hand-off.
In the Service Transition stage, IT focuses on the testing and implementation of the service for its ultimate end users. Critical here is the documentation of the service itself along with the key documentation artifacts required by the operations team to run, troubleshoot, and resolve problems with the service should they later appear. Also key are the establishment of formalized change control procedures in support of future changes and their necessary notification and approval mechanisms. Key activities associated with ITIL's Service Transition stage include:
- Change Management (CM)—The purpose of CM is to ensure that formalized processes and approval mechanisms are set into place and followed to ensure system changes are planned, communicated, documented, and properly tested prior to implementation.
- Service Asset and Configuration Management—SACM works hand-in-hand with CM to support the storage of information about the assets and configuration items that make up a service. Whereas CM deals with the process of managing change, SACM is primarily responsible for its storage and archival.
- Knowledge Management (KM)—Knowledge management helps ensure that IT delivers the right information to the right people so that users can make more informed decisions. Transitioning an IT service of any size involves a knowledge transfer as well. The management of that mindshare between the design team and the operations team is the purview of KM.
- Transition Planning and Support—This activity deals with the actions associated with the transfer itself, ensuring that the transition is planned correctly and occurs smoothly without impact to the business or other services.
- Release and Deployment Management—Correctly implementing the new service as well as approved changes is critical to the transition process. This activity deals with those implementation activities during transition and the beginnings of full operations.
- Service Validation and Testing—Testing is in many ways the most important part of any service implementation. Ensuring that testing is done according to formal and approved processes and certifying the system for operations are also activities here.
- Evaluation—Ensuring that the transitioned service continues to be useful to the business and relates to the original requirements that defined its origination are both key tasks in this activity.
Service Operation
Once fully transitioned, a new business service then enters its longest life cycle stage of full operations. The Service Operation stage deals with the management of the service while operational, the needs of its users throughout operations, and any changes and/or updates to that service as necessary to support those customers. Only in this stage does the service actually provide value to the business, so the measurement of that value is also a major component of this stage. Five processes are associated with this stage:
- Event Management—Events are system notifications directed toward administrators that indicate the status and health of the system. These events can provide information about components that are not functioning properly or that require intervention by an administrator. Events can also alert administrators that the system is operating normally. The Event Management activity deals primarily with the adjudication of these events.
- Incident Management—Incidents are considered unplanned interruptions or degradations of service quality. The management of incidents involves identifying their occurrence and resolving them to bring the system back to full functionality.
- Request Fulfillment—Once services are established into operations, users will then require use of its services. The process of receiving and fulfilling those requests as well as the documentation of those processes required to make and complete a request are all components of this activity.
- Access Management—Related to the Service Design activity of Information Security Management, Access Management is concerned with the assignment of rights and privileges to the system as well as the assurance of data security as a component of those rights. This activity deals with verifying user identities and approving access as well as logging that access.
- Problem Management—By definition, a problem results in the creation of one or more incidents. Thus, resolution of the problem is necessary to eliminate those systemimpacting incidents. Problem Management tracks the root of issues that occur within the system that are causing unplanned interruptions or service degradations and undertakes the proactive task of identifying problems and resolving them before they cause impact.
Continual Service Improvement
The "final" stage of ITIL actually pervades each of the other stages. At every point along the strategy, design, transition, and operation stages, it is important for Continual Service Improvement activities to occur to locate inefficiencies in the service and/or gaps between the functionality provided by a service and the needs of its users. Continual Service Improvement leverages actionable measurements against goals to identify where improvements can be made.
The activities in this stage look at the present baseline to compare its configuration and behavior with measurable targets. Once identified, they then attempt to find actionable changes that can be made to get from the current state to the desired state. Continual Service Improvement includes only a single activity that is comprised of seven steps:
- Define what you should measure
- Define what you can measure
- Gather the data
- Process the data
- Analyze the data
- Present and use the information
- Implement corrective action as needed
Critical within this stage is the concept of its "continuous" occurrence. Throughout each of the other stages, it is important to determine service quality measurements and compare those measurements with desired goals. When a gap is present between what is measured and what is desired, service improvement activities assist at every point in finding an immediate solution. By incorporating continuous incremental improvements to service quality, over time, the service itself improves without needing large-scope extra resources.
BSM Links to ITIL Activities
With this understanding of ITIL and its fit into IT organizations, we must also recognize where it links with BSM. Though BSM's internal calculations and visualizations can in some way feed data into the decision-making processes associated with virtually every component of ITIL, BSM directly impacts only a few of these 24 processes. These activities are highlighted in Figure 9.3.

Figure 9.3: BSM aligns with a subset of ITIL's activities.
Here, the activities that directly gain through BSM's information are those most focused on the measurement and monitoring of service quality and problem resolution:
- The service catalog is a graphical representation of the services as defined by ITIL.
- BSM's tie into service availability feeds metrics into service level management while providing data for capacity and availability measurements.
- Supplier relationships with special consideration towards supplier SLAs can be tightly enforced through BSM data.
- Change, knowledge, and service asset and configuration documentation gain enlightenment through BSM's aggregation of federated change and asset management databases.
- Events, incidents, and problems are all resolved much more quickly through EUE monitoring and its built-in root cause analysis visualizations.
- The entire continual improvement stage is augmented through real-time and highly granular visualizations that show quantitatively how the system is impacted through improvements.
Let's now take a look at each of the activities highlighted in Figure 9.2 and discuss how BSM and the data it provides can specifically assist with each of these ITIL processes.
Service Catalog Management
At the core of BSM is its service model. This model is used by the calculations engine as well as its visualizations to identify the relationships between elements that comprise the business service. As discussed in Chapter 5, the service model maps not only business elements but also their relation to the technical elements that drive the business service. Although BSM's service model is not strictly equivalent to ITIL's service catalog, it is a useful tool for visualizing and modeling many of the services that make up the IT environment.
By navigating through the steps of a BSM implementation, the IT organization is in many ways also preparing a visualization of the service catalog described by ITIL. One advantage of BSM's service model implementation relates to its dynamic nature. Rather than being represented on paper, BSM views the service model as an object upon which characteristics and other behaviors can then be applied. This enlivens ITIL's static representation of available services with dynamic data and inter-linkages.
Service Level Management
Service Level Management is a process for delivering services that consistently meet client requirements. BSM measures operational service quality that is linked to critical business processes in real time and over periods of time. This measurement of quality is defined through the SLAs and Operational Level Agreements (OLAs) that are defined between IT and the business. This directly aligns with the tasks required by ITIL's Service Level Management activity.
As discussed in Chapter 6, BSM enhances the traditional tools used to verify service levels through its use of real-time visualizations. This added data resolution enables business decision makers and IT personnel to better see the results of their actions and how those actions impact the level of service to customers.
Supplier Management
BSM is also an excellent tool for quantitatively verifying the quality of service being received from suppliers and outsourcers. In supplier and outsourcer relationships, it can be challenging without the right monitoring and measurement tools in place to positively verify that the other organization is performing to their contractually defined levels of service. Conversely, when outsourcer metrics are specifically defined within contracts and BSM tools are put into place, it is possible to monitor and remediate supplier SLA breeches as they happen.
For example, if a supplier's equipment is guaranteed to operate with 99.9% uptime, it is possible with BSM monitoring tools to watch for and notify when this level of service has been breached. This information immediately becomes a cost-savings measure that first reduces the impact of downtime while at the same time provides ammunition for the implementing organization to request supplier contract charge backs when breaches occur.
Capacity Management
The EUE component of BSM includes built-in capabilities for ascertaining the true performance impact to a system based on user load, transaction load, and transaction performance and efficiency. Comparing this information with the hardware resources available makes BSM an excellent tool for identifying and monitoring for capacity issues as well as future planning.
Availability Management
BSM and specifically its visualizations provide a heads-up display to various user classes that illuminate problem systems and outage metrics. As with the other metrics discussed in this section, BSM can correlate availability on systems both in real time as well as historically. This provides the IT organization with the ability to do long-term trending analyses in relation to system change.
Change Management
Managing the impact and schedule of desired changes to a system can be particularly challenging when that system is involved with 24-hour operations. BSM's use of the service calendar to identify low-impact opportunities for change activities as well as its integration with other change management toolsets makes it useful for change planning activities.
In addition, pre- and post-change metrics information can be easily correlated through BSM's monitoring capabilities. This provides the business with a quantitative result that assists analysts with verifying the benefit associated with system changes.
Service Asset and Configuration Management
SACM deals predominantly with the storage and archival of asset and configuration item information. Although BSM does not directly affect that storage, its ties into these often disparate systems can be handy. A BSM implementation often layers atop other existing systems within the IT environment, giving it a unique vision into otherwise-segregated change management databases.
Knowledge Management
Knowledge Management processes turn disparate IT data into meaningful information or wisdom with the ultimate goal of improving decision making. Knowledge Management also facilitates the sharing of data between IT silos. Transitioning the correct knowledge from design teams to operations teams is critical to the launch of new services. But also important is the continued knowledge required by operations in administering the system. BSM's visualizations are key components of that ongoing knowledge. Those visualizations provide a single-glimpse understanding associated with system health as well as financial calculations that relate to business decision makers and analysts.
Event Management
Event Management activities in IT environments are often challenging activities. With large event volumes to monitor and complex filtering necessary to distil important events from noise, traditional event monitoring tools are often insufficient for determining business value. BSM's value as a troubleshooting tool to IT administrators means that events across multiple systems can be easily correlated among each other while also being viewed under the light of business relevance. This capability to view system eventing information as an aggregate provides the troubleshooting administrator with a holistic and global view.
As discussed in the previous chapter, BSM's EUE monitoring also augments otherwise static event information with intelligence. This new level of dynamic status information gives troubleshooting teams the ability to drill down through event information towards a problem's solution.
Incident Management
Incidents by definition are symptoms of greater problems, but incident information itself is critical to directing the activities of first responder teams. When incidents occur, it is the first responsibility of IT to triage the situation, isolate the problem, and locate the correct personnel to assist in troubleshooting and resolution. Critical during these situations—especially when multiple, simultaneous incidents occur—is the identification and assignment of the right people towards the right problems.
BSM's metrics associated with user impact augments triage teams with this prioritization information, giving them the metrics they need to direct resources first toward problems with the greatest user impact.
Problem Management
Once an incident has been identified and personnel are brought to bear to fix the problem, BSM's event and transaction monitoring activities bring real-time information to troubleshooting teams to identify the problem's root cause and to understand the problems that are causing the greatest business impact. This information comes in the form of drill-down visualizations that target the specific service quality measurements that are related to the problem at hand.
Continual Service Improvement
Lastly is BSM's influence on the entire stage of Continual Service Improvement. As with many of the other activities here, BSM's reporting data illuminates textual information with graphical representations. These representations provide the analyst with targeted information about the "as is" state with the business service. Analysts can then leverage this information towards defining their desired state through the identification of gap and location of where improvement activities can take place.
As you'll see in the next section, the visualizations used by BSM are designed based on best practices and improvement frameworks such as Six Sigma. The data representations used within the Six Sigma framework—and within BSM's visualizations—have been designed specifically to assist with the improvement process.
What Is Six Sigma?
Six Sigma is a tool pioneered by Motorola back in 1986. Originally designed as a tool to reduce the number of failed components within the manufacturing process, it has grown from those roots to become a powerful framework of tools for identifying areas of improvement within IT service management. The "sigma" in Six Sigma relates to the mathematical standard deviation or level of deviation within a process. The "6" corresponds to what is considered an acceptable level of deviation to strive for within the process, specifically 3.4 defects per million opportunities.
Although many of Six Sigma's early uses were within manufacturing industries for identifying areas within the development of products where defects could be reduced, its use within IT service management has been lauded for providing specific benefits as well. The same Six Sigma principles that were originally used to identify the number of defects and opportunities within a manufacturing system can also be used within IT service management to identify the relation between transaction or process failures (defects) against the total number of completed transactions or processes (opportunities). The following excerpt from the guide Six Sigma for IT Management, this framework provides value to IT service management in several ways (Source: Six Sigma for IT Management, Sven den Boer et al, 1st Edition, Page 29-30):
Gauge process performance through measurements and applied statistics. The process (for example break-fix service under a Service Level Agreement) can be monitored in a very sophisticated way. For this, Six Sigma uses a tool called a control chart. This chart effectively displays the "heartbeat" of the process in time. It states on a periodical basis if your process is still in control and signals when you need to act.
Improve process efficiency in a very concrete and effective way, saving money. The method to improve your business processes proposed by Six Sigma is unique compared to run-of-the-mill methods in that Six Sigma relies solely on solid data and numbers. There is room for intuition awaiting the start of an improvement project, but as soon as the project is started, the numbers, statistics, and mathematics take over. The broad spectrum of analytical tools and techniques allows for problem-solving capabilities that are simply unsurpassed…
Insure to serve your customers by defining and quantifying their needs. The needs of the customer that the process serves are thoroughly mapped out and defined. This is called the external CTQ (Critical to Quality). It is the measurement of reference on the basis of which the customer is satisfied or dissatisfied…
Predict process behavior instead of reacting to it. Six Sigma identifies the root causes for process behavior and thus allows for proactive controlling of these factors, enabling a much better control over the process. In even stronger terms: a mathematical equation will be issued which will predict at least eighty per cent of process behavior. This allows the process to be steered upfront instead of correcting any mistakes later. This avoids mistakes and dissatisfied customers, saving time, money and reputations.
Distinguish between every day fluctuations and signals that need your attention. Six Sigma gives us the root causes for process behavior in a mathematical equation; it also allows us to calculate the lower and upper limits that those root causes may take when affecting the process in order to stay within customer or company specifications on process output. Controlling these inputs on a control chart allows for very rapid signaling when action is required, thus avoiding and counteracting mistakes before they even occur.

Figure 9.4: A representation of the five stages of Six Sigma and the activities associated with each stage.
Deconstructing Six Sigma
The power of Six Sigma is in incorporating mathematical equations to otherwise subjective processes. By incorporating mathematical logic into these otherwise subjective processes, the inefficiencies associated with "gut feelings," politics, and best guesses are flushed out of the decision-making process in favor of improvement activities that show quantitative benefit.
Six Sigma aligns with the "final" Continual Service Improvement stage of ITIL. In contrast with ITIL's subjective approach, however, Six Sigma's tools enable highly quantitative measurements. It is for this reason that Six Sigma is used within BSM, due to BSM's collection and presentation of highly quantitative measurements. To this end, the technology of BSM and the framework of Six Sigma complement each other perfectly.
As Figure 9.4 shows, Six Sigma generally includes five stages through which a process is defined, measured, analyzed, improved, and ultimately controlled. As with ITIL's stages, there are a number of activities associated with each stage.
Define
Six Sigma's Define stage incorporates the identification of the business services or components that are Critical to Quality. These components are identified and broken down into their disparate elements to set the "as is" state within the environment. Here, sampling and baselining activities are used to assist with establishing a firm starting point so that later measurements can be taken to compare the results after the improvement is implemented.
Measure
Once the elements to be improved are fully defined through the first step, they are then translated into measureable quantities within the Measure stage. These measurements are used within Six Sigma's mathematical representations of the process and its quality. In this step, a number of tools are used to assist with this quantification, a few of which are outlined in Figure 9.4. The Cost of Poor Quality metric in relation to IT service management measures the cost associated with results that do not meet the needs of users. Failure Mode Effect Analyses, Pareto Charts, and Histograms are all graphical tools with which processes and their interrelations can be quantitatively measured.
Analyze
Once measurements are set into place, it is then possible to run simulations based on the results of those measurements to identify where improvements can take place. In the Analyze phase, those what-if analyses are used along with failure mode reviews and other tools to look objectively at the data being presented with an eye towards where improvements can be made. Typically, the final goals of a Six Sigma project are not well defined until gaps are identified through the analysis done in this phase.
Improve
With the right data in hand, it is then possible to hypothesize potential improvements that will have impact on the system. Because the service or component under scrutiny now has measurable elements defined and in-place, it is possible to test those hypotheses while measuring their result. Here within the Improve phase, improvements are laid into place along with permanent measurements that measure the boundaries of tolerance associated with the improved process and its inputs.
Control
With the implementation of the improvement it is also necessary to build a set of controls to ensure that it remains improved over time. The final step in this process is the Control phase, which is involved with the establishment of procedures, monitoring, and the necessary measurement to validate the process and its level of quality.
Six Sigma Metrics Align with BSM Visualization Tools
Six Sigma is very obviously a data-driven activity, which is why it integrates extremely well with the data-driven results available from a BSM implementation. BSM's native instrumentation alongside its integrations with other IT and financial management systems gives it a wide-reaching perspective of the metrics associated with the running of IT systems.
Six Sigma projects can suffer in situations where data collection is challenging or requires special devices or toolsets to accomplish the collection. Those toolsets can be complicated or expensive to implement if they are new to the environment. Conversely, integrating Six Sigma with BSM makes easy this process of data collection. BSM is likely already collecting the data needed by a Six Sigma improvement activity. Thus, reconfiguring BSM's data collection, its internal calculations, or its visualizations can quickly provide the types of data needed to define, measure, and analyze existing processes.
Let's look now at a few examples of BSM visualization tools that quickly ramp up the data collection and analysis components of Six Sigma. The images in this section you've seen before in Chapter 7. Whereas in that chapter they were presented to show examples of BSM visualizations and their utility, they're reproduced here to show how they augment Six Sigma analyses.
Control Charts
Even with technical systems such as the computers that drive business services, each time a process is run through to completion, it can experience slightly different behaviors. Network connectivity, user confusion, interface differences, and transaction processing performance all lead that business service to process individual transactions with a slightly different behavior over time.
A Six Sigma Control Chart is one tool that can be used to model this behavior. By graphically representing a process over time in relation to its acceptable upper and lower bounds, it is possible to visually see how the quality of that process has behaved over time. When coupled with improvement and control activities, these charts can be used to positively show improvement as well as ensure that improvement remains over time.
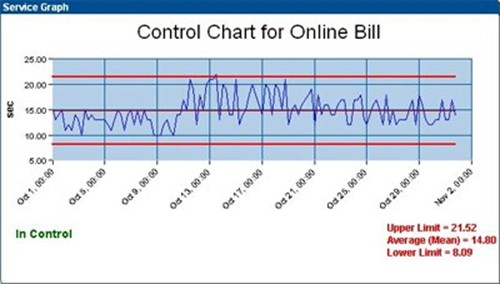
Figure 9.5: A representative sample of a control chart.
Process Sigma Charts
Six Sigma is highly concerned with the number of defects per number of opportunities that occur within a process. To show this representation in a visual format, the Process Sigma Chart shows the reader the quality of the process based on the number of times that process is run in comparison with the number of time it fails over time.
Relating this information to BSM, these metrics can illustrate the behavior of business system elements, transactions, or virtually any other measured metric. As you can see in Figure 9.6, Process Sigma is illustrated in terms of a line graph that shows how well the measured element has performed over a period of time. By measuring this historical information as a part of BSM's instrumentation, it is easy to gather the critical metrics that show the behavior of transactions and other processes before, during, and after improvements have been implemented.

Figure 9.6: A representative sample of a Process Sigma chart.
Pareto Charts
Within any improvement activity will be possibilities that fix large scopes of problems while others have little impact to the overall situation. Six Sigma identifies an 80/20 rule between these extremes of possibilities, to mean that 80% of the defects that arise within the measured environment are often caused by 20% of the sources.
The Pareto Principle is seen in many areas within business and outside. It was originally conceptualized by Vilfredo Pareto in 1906 when he discovered that 80% of the land in his home country of Italy was owned by 20% of the population.
In IT environments, this ratio often holds true as well. For example, 80% of the Help desk tickets are often requested by 20% of the user population. Or, 80% of the system-affecting problems are often caused by 20% of the potential sources for those problems.
Due to the regular appearance of this principle in natural environments, the Pareto Chart becomes a handy tool to be used in identifying those improvement activities that are likely to have the highest impact on operations. In Figure 9.7, we see that the highest percentage of outages is associated with IT issues, followed closely by intranet issues. By virtue of this information, we can assume that improving IT issues will have the highest impact to outages, followed by improvements to the intranet.
The data that feeds into this chart assists the Six Sigma team with focusing their attention on issues that ultimately have the highest impact to operations. With limited personnel and financial resources available, this type of chart ensures that resources are being spent wisely and towards the issues that provide the greatest possible benefit to the organization.

Figure 9.7: A representative sample of a Pareto chart.
Breach Charts
Breach charts are another tool used in BSM visualizations that show when metrics being measured by SLAs have gone out of their acceptable range. These types of charts and reports assist the Six Sigma team with identifying which service elements tend to go beyond their acceptable ranges more often than others. Improvement activities associated with these findings can determine that some component of the measured element requires improvement or that the boundaries created by the SLA itself are not appropriately designed.
There are multiple kinds of charts and reports that detail information about monitored elements and their level of breach. Figure 9.8 shows one such example. In this figure, you can see that only one of the five metrics measured actually met its SLA. This knowledge along with the drilldown information that further explains the problem helps the Six Sigma team determine where to apply their energies.

Figure 9.8: A representative sample of a breach chart.
Six Sigma and ITIL Complement Each Other
Easily the most important point to gain from this chapter and from the use of both frameworks is that each complements the other. ITIL itself is a framework of best practices that have been put together to assist in the delivery and support of IT services. But ITIL alone doesn't include the quantitative analysis tools and functions necessary to bring numerically based improvements to those functions when needed.
Similarly, when constrained to the data transactions typically measured and monitored by BSM, ITIL alone is often not best suited to assist with the necessary improvements associated with their processing. Another suite of tools is necessary. The need for that suite of tools can be fulfilled through implementation of Six Sigma practices into ITIL's Continual Quality Improvement stage. As we've seen in the second half of this chapter, Six Sigma embodies the mathematical representation of this stage. As you can see in Figure 9.10, the five stages of Six Sigma's process improvement framework maps directly into ITIL's Continual Service Improvement activities.

Figure 9.10: Six Sigma's five stages map to ITIL's seven-step Continual Service Improvement stage.
Combining BSM with Six Sigma and ITIL
Swinging all of this back to our discussion on BSM, the chart and graph definitions one obtains through the implementation of the Six Sigma framework are an easy fit into BSM's visualization layer. Without tools such as BSM in place, the process to gather the necessary hard numerical data to populate Six Sigma's first three steps can be challenging and expensive. Conversely, with BSM's data gathering instrumentation in place along with its highly customizable visualizations engine, those same steps can be easily input into the BSM system for quick data gathering, display, and later analysis.
And thus, with the conclusion of this chapter comes the real conclusion of our discussion on BSM. Throughout this chapter and this guide, we've attempted to bring to you a summary discussion on the implementation, the value gained, and the ways in which BSM improves the management of IT services within an organization.
Chapter 10, the final chapter in this guide, will wrap up our extended conversation. We'll review each of the topics throughout the past nine chapters to provide a summary of the information you need to know in order to best implement BSM within your organization.