Performance Testing
We're approaching the end of our exploration of quality application delivery, but that doesn't mean that this chapter's topic—performance—should be considered an afterthought or somehow of lesser importance. As I've discussed in previous chapters, in fact, performance is very often the first thing that end users see that gives them a good or bad perception of the application's overall performance.
Why Performance?
It's funny: I don't think I've ever seen a user believe that an application was a quality one simply because it ran quickly. However, a slow application is immediately perceived as being of low quality, even if the rest of the application is fantastic. Take Apple's iPhone: When the company released a beta of its v3.0 firmware, they loaded it with subtle and important new features, most of which operated exactly as advertised. But, being beta (and probably loaded with extraneous debugging code), it was far more sluggish than the previous production‐quality release, so, despite all the working features, it was perceived by many to be of low quality, and much was written in the blogosphere about how to downgrade to a prior version.
The world's well‐made software, and computers in general, have contributed to a declining lack of patience in user communities. Even if an application has a perfectly good reason to be responding slowly—perhaps it's querying millions of rows of data—users simply cannot tolerate much less than instantaneous results. Their lack of patience often turns into negative messaging that goes out to their company's customers: "I'm sorry, sir," is the often‐heard phone agent phrase, "the computers are slow today."
The other tricky thing about performance, of course, is that it's situational: An application might run great in the development environment, even when you're simulating a production workload. Out in the real production world, however, you have hundreds of factors to contend with: Client computer capability, networking conditions, growing data stores, and so forth, all of which can contribute to poor (even if just in perception) performance, and which are incredibly difficult to troubleshoot and solve. When multiple users start using an application, you're opening up whole new areas for potential bottlenecks: network communications may jam up when thousands of users try to log on, server components may experience unseen locking and synchronicity problems when user loads increase, or client applications may lock up or crash when server components time out during periods of high application utilization.
That's why no developer should be expected to write an application that achieves some unvoiced, unquantified level of performance, and why everyone involved with a project needs to realize that performance is a continuous scale, and that at some point someone needs to put a stick in the ground and decide exactly what performance is right for the project. That's called writing performance requirements.
Dead Air = Poor Quality?
You have to be a bit careful when taking user feedback with regards to performance. A couple of generations have now been raised on cable news shows and other media where "dead air"—silence—is considered "poor show," and on‐air personalities will chatter about anything to avoid silence. This attitude has extended itself to our daily lives, where we even expect to be entertained by music or advertising when we're placed on hold during a phone call. So, when a phone agent at a call‐in center is waiting on an application—even for completely legitimate reasons—they feel the need to fill that "dead air" and chatter—usually about how slow their computer is.
Be creative and cautious when analyzing this behavior and deciding what to do about it. For example, spending tens of thousands of dollars speeding up the application may not be practical, especially when the application is actually performing well given what it's doing. A better solution, in those cases, might be to avoid the appearance of poor performance and to fill the "dead air:" I've seen one company whose applications automatically display conversation suggestions (often related around upsell products and services) that phone agents can use to make small talk while the application is doing something intensive. This helps remove the perception of poor performance by filling the silence with something useful and business‐related.
This isn't to say that filling the silence with advertising is always the acceptable solution: You absolutely should focus on achieving the right level of application performance. But when you've done that and are simply combating perception, getting a bit creative can help solve the business need less expensively than chasing after an impractical level of performance.
Performance and Requirements
I've already discussed at length the need for everything in the project to be driven by requirements. But what makes a good performance requirement? Consider this one:
- The ability to handle a large workload with minimal processor time and to increase the maximum achievable workload utilizing standard hardware scaling techniques. This isn't a good requirement. Why not?
- It doesn't quantify the "large workload." What does "large" consist of?
- What is the "maximum achievable" workload? Do we have an infinite amount of time and money to spend on this, or is there some quantifiable, desired maximum we should be aiming for?
- What are "standard hardware scaling techniques?" Adding memory? More processors? How many? Infinite? Is money no object? Or is there some practical upper limit that we want to define?
Performance requirements work best with numbers. For example, start by defining what the production environment looks like, using a table like the one in Figure 9.1 (which is taken from an excellent discussion of writing performance requirements, at http://www.cmg.org/measureit/issues/mit23/m_23_2.html).
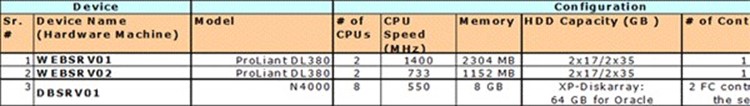
Figure 9.1: Inventorying the environment.
Then, examine different critical business processes and analyze the time it takes to complete them, and the exact workload in effect at the time. Figure 9.2 shows a short example of this.
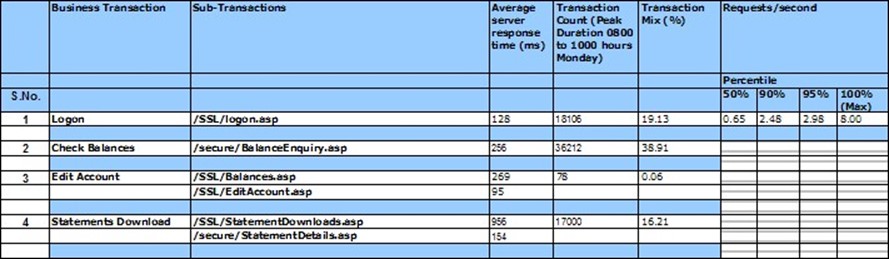
Figure 9.2: Measuring current usage.
And here's where things often get missed: Anticipate growth. A chart like the one in Figure 9.3 can help convey the amount of the data the system will deal with, when that data will be purged, and so forth. This helps designers and developers understand the quantity of data they will have to deal with, and that's a crucial statistic to have when planning for performance.
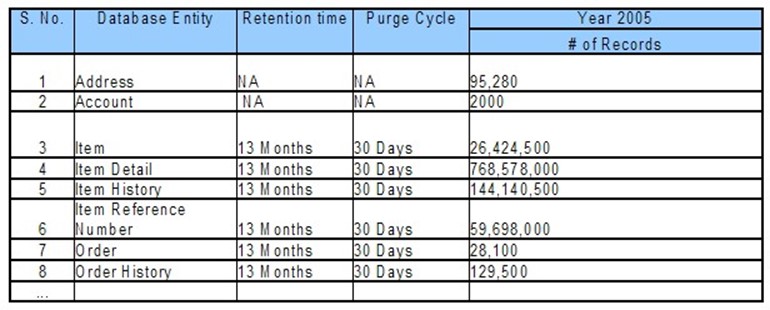
Figure 9.3: Measuring data usage and estimating growth.
Given all that data, start projecting for growth—and add a pad of 20% or so. Figure 9.4 shows an example of key business transactions, the percentage each one contributes to the overall mix of operations, and the expected peak usage with a 20% pad—giving designers an exact number to work against, testers an exact number to test against, and so forth.
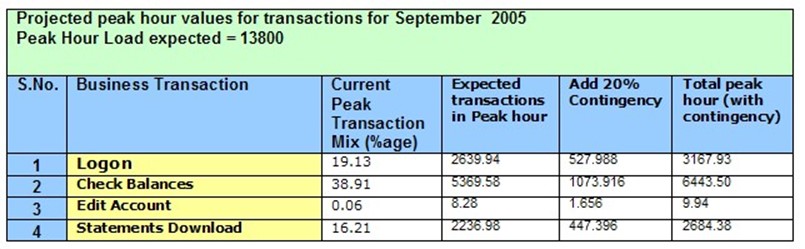
Figure 9.4: Estimating required load
Figure 9.5 shows an example set of application requirements, focused on the performancebased requirements. This is a template published by the US Centers for Disease Control (CDC) for use in their own projects. Note that this isn't specific to software projects (and in fact I've selected a sample that isn't, just to illustrate that these concepts are universal); and that they provide a requirement, a standard that is to be met, a method by which performance will be measured, and so forth.

Figure 9.5: Writing definitive, measurable performance requirements.
Remember: You want to start with defined, measurable performance requirements that specify numeric metrics and include information about anticipated growth and workload. Without those, you're never going to achieve an acceptable level of performance because you won't know what "acceptable" is.
Performance and Perception
So what happens when you've defined and achieved "acceptable" performance, but users still think your application is slow?
The problem is user perception, and in many cases the answer is not to chase after faster and faster performance, but rather to chase after a faster perception of performance.
Simply aiming for a faster application gets logarithmically more expensive: Squeezing an extra 1% performance gain might initially cost you x, but the next 1% will be x*1.2, then x*2.1, and so forth. But in many cases you have an application that's already performing at acceptable levels by everything you can measure, so why spend all that extra money squeezing more performance out of it? Instead, focus on what users perceive as poor performance, and address the perception.
Figure 9.6 shows what causes most users to develop a perception of poor performance:

Figure 9.6: The Windows hourglass.
Waiting, with nothing happening except for an hourglass spinning on the screen. I secretly believe that the reason Windows Vista adopted the "glowing circle of waiting" over the old hourglass was as much about providing a less‐blatant icon as it as about a more refined user interface. So ask yourself: What can you do to your application to reduce the amount of time that the hourglass spends on the screen? Is it possible, for example, to construct the application to perform a larger number of smaller, more discrete operations over one giant operation? Smaller operations might allow you to start populating a user interface sooner, so that users have some visible measure of progress.
Caution: Don't be tempted to simply use progress bar user interface devices unless you're certain you can make an accurate progress bar. Everyone hates it when they're watching a progress bar change from "1 minute remaining" to "5 minutes remaining" halfway through the process—it feels like the computer is cheating, and you're still effectively just watching the hourglass spin itself around and around.
Apple's Human Interface Guidelines has some wise statements about performance and perception:
Performance is the perceived measure of how fast or efficient your software is and it is critical to the success of all software. If your software seems slow, users may be less inclined to buy it. Even software that uses the most optimal algorithms may seem slow if it spends more time processing data than responding to the user. ... Remember that the perception of performance is informed by two things: The speed with which an application processes data and performs operations and the speed with which the application responds to the user.
In other words, perception may not equal reality, and perception is more important. Author Steven C. Seow wrote a book, Designing and Engineering Time, which lays out some specific, measurable numbers that relate to perception. He suggests that operations which complete within specific time ranges will be perceived in specific ways by most users:
Instantaneous (0.1 to 0.2 seconds)
Immediate (0.5 to 1.0 second)
Continuous (2 to 5 seconds)
Captive (7 to 10 seconds)
You can use these numbers—since they are definite and measurable—as part of your application's requirements. Requiring that, "dialog boxes must populate in an Immediate timeframe except as noted otherwise within these requirements" is a measurable, testable objective. In some instances, the only way to achieve it might be to present less information on a dialog box (thus reducing the amount of time it takes to retrieve data), so you may have some tension between performance and the desired workflow. You can read an excellent discussion on this topic at http://unweary.com/2008/11/specifyingperformance.html.
Other research conducted in the late 1980s also lays out metrics for performance that relate to user perception; you can read an excellent discussion in The Art of Application Performance Testing by Ian Molyneaux.
Tools: More Important than Ever
There are two ways to test performance, and there are also two general types of performance test. Each of these absolutely depends on you having performance goals and expectations that can be expressed numerically.
The two test types are:
- Testing the application's ability to handle a specific workload—that is, a specified number of simultaneous users performing a specified set of operations during a specified timeframe.
- Testing the application's responsiveness in specific transactions—in other words, testing the user perception
These two test types are obviously interrelated; you typically perform testing that measures both of these elements. After all, the performance a user perceives is definitely affected by the workload that the application is undergoing. So testing often consists of hitting the application with a simulated workload, and then using the application and measuring the response times a user might see for specific operations.
Note: What is workload? It's simply the performance of operations that you expect your users to be doing. If you expect 1000 users to be entering a single sales order apiece every 5 minutes, then that's your workload. Since that's your expectation, you'll want to try and test to make sure your application can handle it; stress testing might be entering even more sales orders at once, from a larger number of simultaneous users, to see how long the application can keep up before failing or slowing to an unacceptable level of performance.
And of course the two means of conducting these tests are manually and automatically. However, before we dive into these, it's important to understand that you can also performance test the application's code. That's a little different from true, wholeapplication testing, and it is generally conducted by developers who are searching for specific areas of their code where performance is taking a hit.
Manual Testing
Manual performance testing, in my considered opinion, is horrible. For one, it's incredibly, incredibly boring. Boring leads to inconsistent, and inconsistent testing is worse than no testing at all because it generates false alerts, misses important aspects, and generally can't be relied upon.
I used to think that manual testing was at least valid for making sure that user perception metrics—like the amount of time a particular dialog box takes to populate itself—since it was a real user using the application. But even that wears thin on a tester's attention span after two or three cycles, so I now truly believe that the only reason to test something manually is because you've got a tool recording what you're doing, so that future cycles can be automated.
I've said before that automation (and the tools that enable automation) won't add any more quality than what you already have. That's still true; if you can't engage in a manual test, then you won't know what to automate. But tools can and do make testing faster and more consistent, and modern testing tools can easily capture things like execution times to make sure you're hitting your performance metrics.
Manual testing becomes outright impractical when you start talking about load testing: It's not feasible to have five hundred human beings manually testing an application at the same time in order to test its ability to handle that workload. Automation is the only way to conduct effective, reliable load testing.
Automated testing is also the only way to spot seemingly‐random problems that result only when multiple users are using an application simultaneously. For example, consider a simple scenario where an application creates some sort of status file on disk when a user performs a specific operation. The file is deleted when the operation completes. With a single user, there's no problem—and even with several users, no problem might occur, because none of them are performing the operation at exactly the same time. With enough simultaneous users, however, you realize that the application isn't creating one status file per user, it's creating just one file—and two users performing the same operation at the exact same time reveals the bug. Manual testing could rarely catch this; automated testing often can.
Automated Application Testing
Whole‐application testing utilizes automated tools to interact with an application in much the same way that a human user would, only faster and without the human actually being present. These tools commonly rely on sophisticated scripts, which may be created by recording, or "watching," an actual human interact with the application the first time around. These scripts can check back‐end data, examine on‐screen data, and use other indicators to determine if a test is successful or not, and they can measure basic execution times to develop performance measurements. Automated tests can also perform load testing, where the testing tool simulates the activity of many—potentially hundreds—of users interacting with the application at the same time.
Automated Code Testing
Code testing is often conducted by developers, with the goal of identifying specific bits of code that are consuming the most overhead in terms of performance. This is usually a step conducted after whole‐application testing identifies unacceptable performance. If, for example, a given dialog box is taking too long to populate or a particular transaction is taking too long to complete, then a developer might run deeper‐level performance testing against their code to identify pieces of the code that are contributing to the overall performance problem.
Blurring the Lines
Modern testing applications often blur the line between "whole application" and "code" testing by providing both capabilities within a single solution or suite. That is, some tools or suites of tools can not only automate the end‐user interaction and identify poor performance, but they can also dig deeper and identify specific sections of code that are having performance problems. Whether these capabilities come paired in a single testing application or not isn't relevant; you do need both capabilities, and they're commonly used by different members of the projects team (QA and developers), although they're often used in conjunction and to achieve the same business goals.
Working with Performance
So you know what kind of performance you want, and you're familiar with the basic types of testing. Now it's time to start discussing testing specifics. I'll break this down into two main sections: Load testing, which tends to focus most on whole‐application performance, and deeper‐level performance testing that works a bit more at a developer‐centric level, and which are often used to pinpoint problems detected during load testing.
Load Testing
Load testing is typically conducted by creating testing scripts that simulate end‐user interaction with an application, and then using an automated load testing tool to run that script in hundreds of parallel streams, to simulate the usage of many, many users at once. Some testing tools are capable, with the right infrastructure, of simulating the load of hundreds of thousands of users—enough to get a clear performance picture of almost any anticipated production workload. In fact, tools with this kind of power can be used to stress‐test an application, and predict how many users it will be able to support at a given level of responsiveness, and to predict the total number of users it can support before failing outright.
The most time‐consuming part of load testing is usually the initial development of the testing scripts. These need to accurately reflect real‐world usage scenarios, but ideally need to require a minimal skill set in programming—skills that are often in short supply in QA teams. Many tools, like the on pictured in Figure 9.7, utilize graphical, workflow‐driven design tools to help create testing scripts with less overt programming. They also often offer the ability to record manual application usage or traffic, observing that usage and automatically generating a script to replicate that usage.
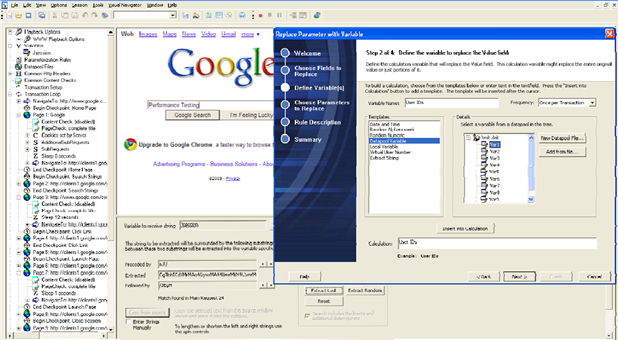
Figure 9.7: Developing testing scripts.
Since performance is the goal here, tools should be able to provide performance analysis. This is often performed by specifying performance "checkpoints" at various key places in the testing script, essentially telling the testing tool that, "at this point, no more than x seconds should have elapsed." Figure 9.8 shows an example of the types of results a tool can generate from those checkpoints.
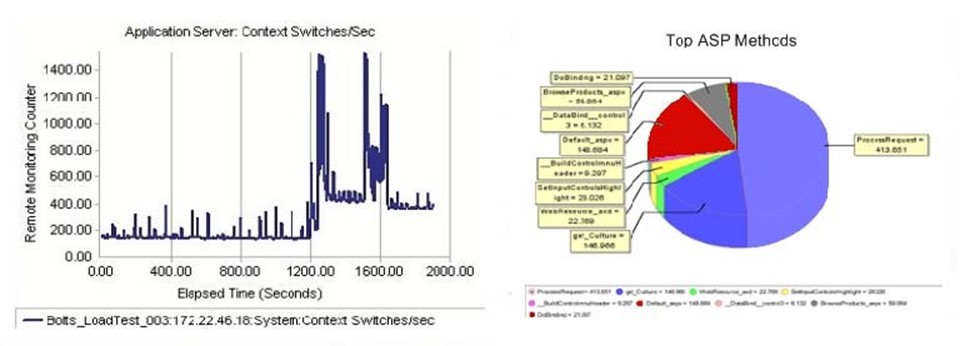
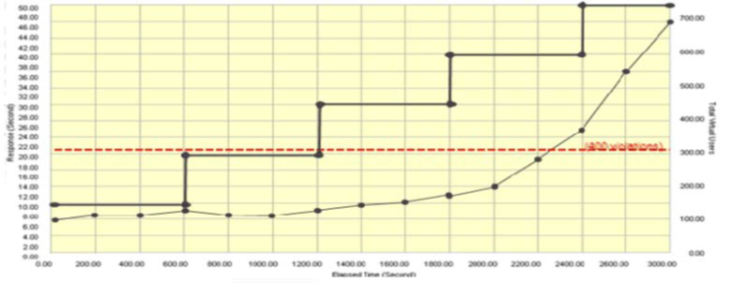
Figure 9.8: Example performance analysis results.
This approach to load testing typically provides the "whole‐application" testing that a QA team would conduct. If poor performance is identifies, the tools may be able to pinpoint specific bottlenecks—like memory consumption—or developers may need to dig deeper and perform code‐level performance testing and tuning.
There are two things you need to look at in terms of performance. First, the overall performance of the application as it would be perceived by a user. That's obviously important, but so is the second thing: The individual performance of infrastructure elements, such as the network and storage, as well as individual supporting applications, such as database servers. Good overall performance but poor performance from a single element (such as the network) may be indicative of a configuration problem and, at the very least, suggests that you'll be facing performance issues in the future.
Why Reports? Performance reports from a load‐testing tool are not only useful at helping to identify problem areas, but they're also an incredibly useful management tool. By retaining performance reports from throughout the project lifecycle, you can map the project's progress with regard to performance and relate that progress back to the time, money, and other resources expended in getting there. In other words, you can see what it's costing you to achieve a given level of performance, and use that information to estimate what additional progress is going to cost—and then decide if it's worth it or not.
Performance Testing and Tuning
Many modern programming platforms, including Java and .NET, offer a "black box" runtime environment where it can be difficult to determine actual performance metrics— everything runs inside what seems to be a sealed environment. The right testing tools, however, can dig inside that sealed environment to expose a broad performance view. Some of these tools are useful at a high‐level of application performance, while others are useful at a lower, more code‐specific level.
For example, Figure 9.9 shows a tool that exposes a customizable dashboard that monitors specific .NET components and provides performance information on each of them. This is more detailed than a whole‐application view, because it helps focus on specific components that may be contributing to an overall performance problem.

Figure 9.9: Viewing componentlevel performance in a dashboard.
Tools can also help monitor a specific application's performance with relation to specified performance goals like Service Level Agreements (SLAs). Rather than analyzing end‐user performance—like the time a dialog takes to populate—these tools often rely on more back‐end metrics, like the time it takes for certain database calls to execute. Again, this deeper‐level view of performance can help pinpoint areas that are contributing to a performance problem. Figure 9.10 shows how a tool can deliver this information, using both raw statistics as well as graphical charts that help you to visualize the performance more easily.

Figure 9.10: Analyzing performance against predefined goals.
When you identify a performance problem, digging deeper to find the root cause can be complicated. Again, tools can help by tracing low‐level activity, such as transactions, use of individual methods, and so forth. A "transaction viewer" like the one shown in Figure 9.11 can break down exactly how much time is being spent on specific database calls or transactions, allowing you to quickly spot those which are consuming the most time and to focus your performance‐improvement efforts where they're most needed.

Figure 9.11: Viewing transaction performance from an application.
Similarly, tools may also be able to break down transaction performance into individual method calls, helping you further drill down into the portions of the application that are consuming the most time. Figure 9.12 shows this type of view, where each method's contribution to the overall transaction is shown, along with statistics like CPU calls.
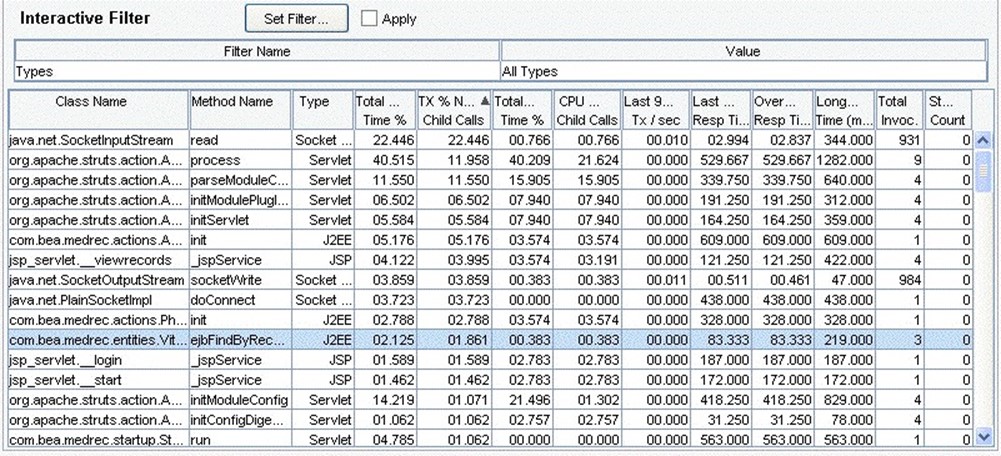
Figure 9.12: Reviewing performance on a permethod basis.
Dealing with all those raw numbers can sometimes be less than productive, so many tools can visualize the data in charts or graphs—such as the one shown in Figure 9.13, which illustrates the top ten worst‐performing methods in an application. This type of visualization makes it easier to see where your development efforts should be directed for the most impact.

Figure 9.13: Viewing permethod performance data in a chart.
Tools may also integrate directly with a development environment like Visual Studio, or may offer deeper‐level analysis of individual code performance. For example, Figure 9.14 shows a call graph generated by an application performance testing tool.
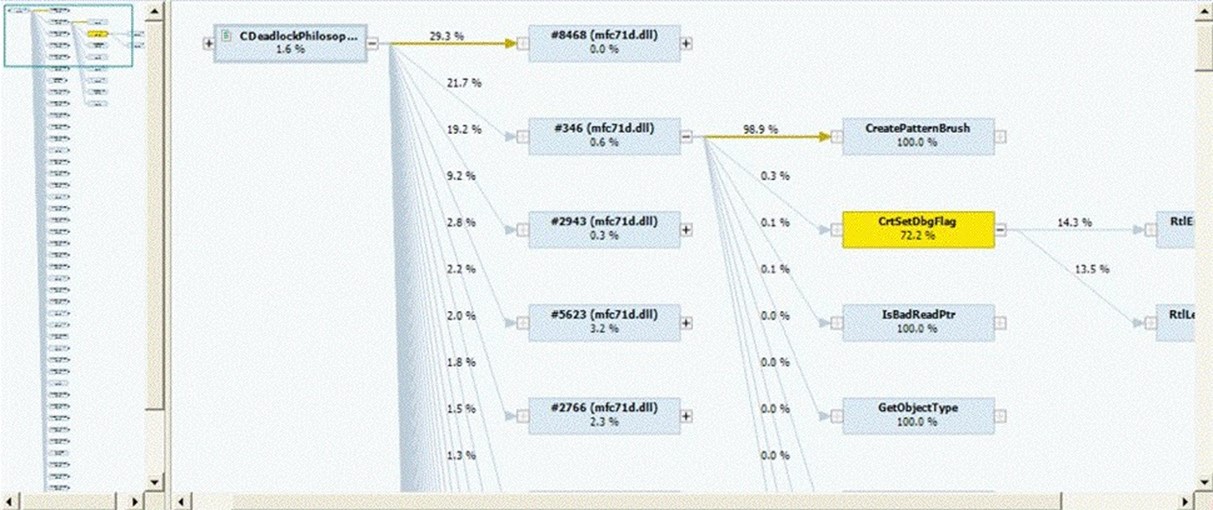
Figure 9.14: Application call graph.
This type of graph illustrates two important things: The actual execution path that the application is taking, as well as the amount of time each individual code module is contributing to the overall application performance. This can make it very easy to see where you're suffering the most on performance, allowing you to focus your efforts much more effectively.
So many of today's applications are data‐driven that the data layer must often be treated as a unique and important component. Some testing tools are able to analyze database traffic directly on compatible database server platforms, generating statistics like the ones shown in Figure 9.15.
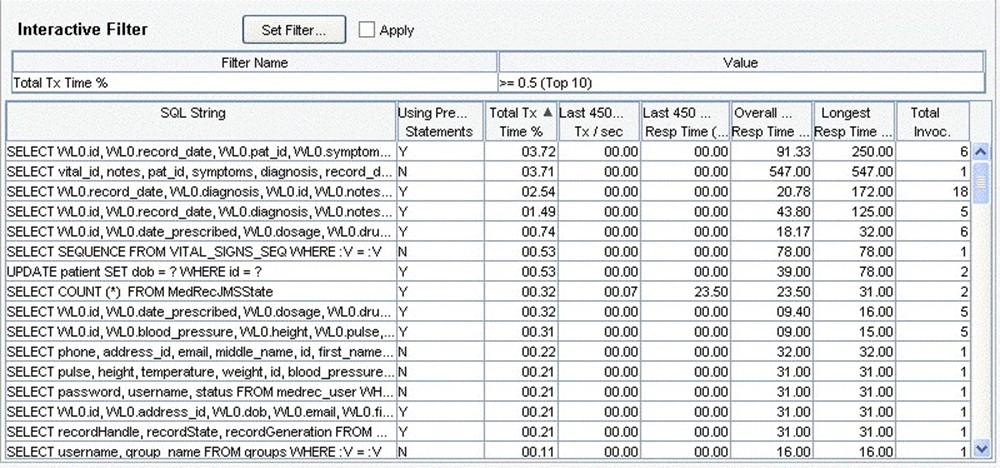
Figure 9.15: Analyzing database performance.
Here, specific database queries are captured and their performance analyzed. By detecting poor‐performing database statements from within the same toolset, you can not only focus your efforts to poor‐performing components, but to specific database calls which may require additional fine‐tuning in the database layer itself (such as re‐thinking your indexing strategy, rebuilding or reorganizing data and indexes, and so forth).
Finally, some performance problems are buried so deeply in runtime components that, while your code may actually be at fault, the problem itself is incredibly difficult to detect. Chief amongst these types of problems in my experience is a memory leak. A good performance tool will be able to monitor application memory usage, ideally by digging into the development framework's runtimes, and bring your attention to memory leaks and their sources. Figure 9.16 shows an example of one tool being used to detect memory leaks.
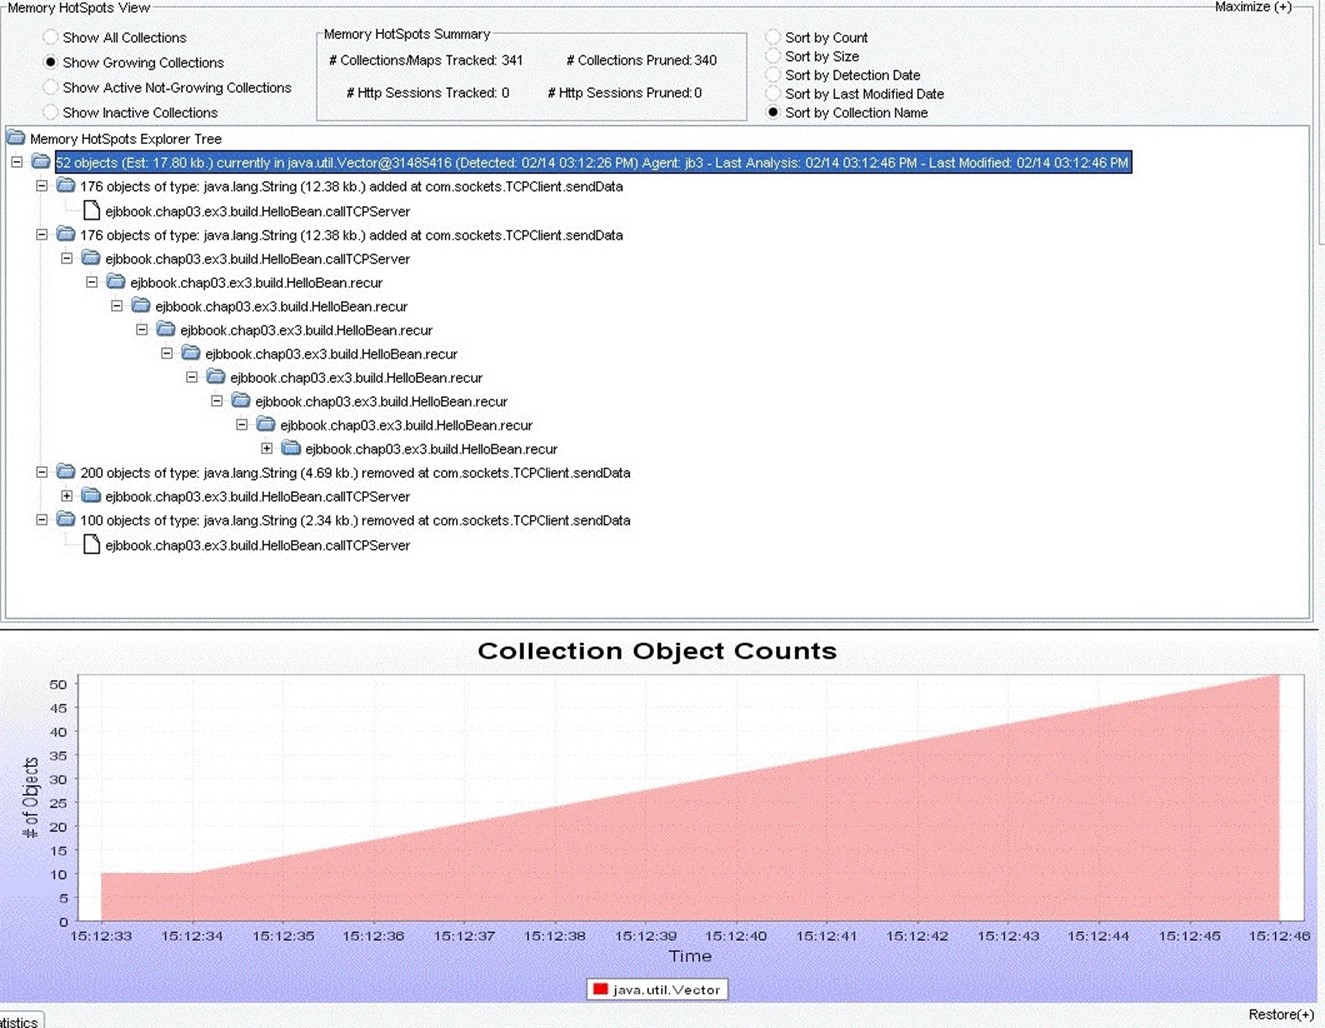
Figure 9.16: Detecting memory leaks in a running Java application.
Finally, some of the tools designed for this type of developer‐level detail can also take you back to the higher‐level, user‐perspective performance. This isn't load testing; it's analyzing the application's real‐world production‐style performance and, using checkmarks and metrics you define, indicating which transactions are happening at a useracceptable level, and which ones are beginning to fall behind. Figure 9.17 shows an example of a report which a tool might generate that addresses specific end‐user perceptions of performance, based on previously‐defined metrics. You're not trying to measure production application using developer tools, of course, but you are trying to measure performance in the same way that it will be reviewed once the application is in production.

Figure 9.17: Reviewing "perspective performance" and detecting poorperforming transactions.
Note that none of this information can be practically gathered without the right tools— manual testing simply isn't an option.
The Performance Game
The performance game can be tricky, but with the right equipment and a firm knowledge of the game's rules, you can absolutely succeed at delivering applications with better performance—both measurable and perceptive. The rules are actually straightforward:
- Establish your performance goals, using language that is clearly defined, lends itself to testing and verification, and ideally uses hard numbers rather than vague statements. Focus on performance goals that address the entire application's performance, such as times to complete specific transactions, workload estimates, and so forth.
- Inventory the production environment, and estimate the amount of data that the application will handle now and into the future.
- Test the application using load testing tools. Use tools that support the use of performance checkpoints, so that you can get automated performance reports. Use those reports to identify any metrics which aren't being met—this is detecting the problem.
- Dig deeper with performance testing tools that can monitor the running application and analyze it at a fairly deep level. This is focusing your efforts on the root cause of the performance problem that you detected.
Those four steps—establish, inventory, detect, and focus—define your performance goals and provide a means of solving performance problems. It all takes the right tools, though.
- Tools can help track your performance requirements throughout the project, and provide a basis for building test scenarios.
- Tools can help automate the testing process and detect problems faster and more accurately.
- Tools can help focus your efforts at finding the root cause of a performance problem.
Get Ready to Deliver Quality
We've nearly reached the end of our discussion on quality application delivery. In this chapter, we focused on performance and the various ways to detect and solve performance problems using automated tools. In the next and final chapter, we're going to bring everything together. We'll look at quality application delivery holistically, review some of the key points from previous chapters, and create a sort of "shopping list" for procedures, techniques, and tools that you should begin acquiring for your environment. We'll also create "report cards" that can be used to continually assess the quality efforts within your organization and to help drive and direct continuing quality maturity.