Problem Resolution in Virtualized Environments
Problem Resolution in Virtualized Environments
This final chapter looks at the all-important processes that surround the identification and resolution of IT problems. Virtualization along with the service-centric management technologies that wrap around it come together in ways that greatly enhance problem identification. As this step usually consumes the largest amount of time in the resolution process, speeding problem identification has a substantial impact on overall data center health.
It is with this concept of "health" that this chapter will spend a large amount of time, as it is the health of systems that defines whether they are capable of fulfilling their stated missions. An unhealthy piece of the IT infrastructure will not be able to provide good quality service to its customers, while one that is healthy will. An unhealthy component is a ready source of IT problems, while a healthy one does not need special attention.
And yet identifying which systems are healthy and which are not is a complicated undertaking. What makes a physical or virtual machine unhealthy? Is there a functional problem with the system itself? Is it performing or failing at its task? Is the system even operational or has it gone down for some reason or another? All these are important questions to ask when considering the problem identification process, but the determination of a system's health goes even deeper. Consider some of the deeper-level questions that must be asked:
- Is it a problem if a system's disks are reading and writing data at a lower rate than normal?
- Is it a problem if memory or processor utilization is greater than a specific amount?
- Are there problems with the underlying virtualization platform? Are they manifesting into issues with the virtual machines themselves?
- Is there a downstream system that is relied upon whose problem impacts the system we are looking at?
With virtually every IT service requiring more than one element—server, network, storage, and so on—for its proper functionality, the job of problem identification is a complex one. As you'll soon discover, making the move to virtualization also adds layers of complexity that further complicates problem identification and resolution.
Chapter 2 introduced the image shown again in Figure 4.1 and explained how effective servicecentric management platforms arrived equipped with integration capabilities that link into virtually every part of the IT ecosystem. Monitoring components that watch physical servers as well as virtual, the status of their virtual platform management toolsets, and critical network and storage components is necessary for gaining a holistic situational awareness of the environment. Only by using unified monitoring across every component of the IT infrastructure is it possible to understand how and where each component links to others. Only by leveraging that system to draw dependencies between elements can an IT infrastructure quickly understand the root source of problems and move towards solutions.
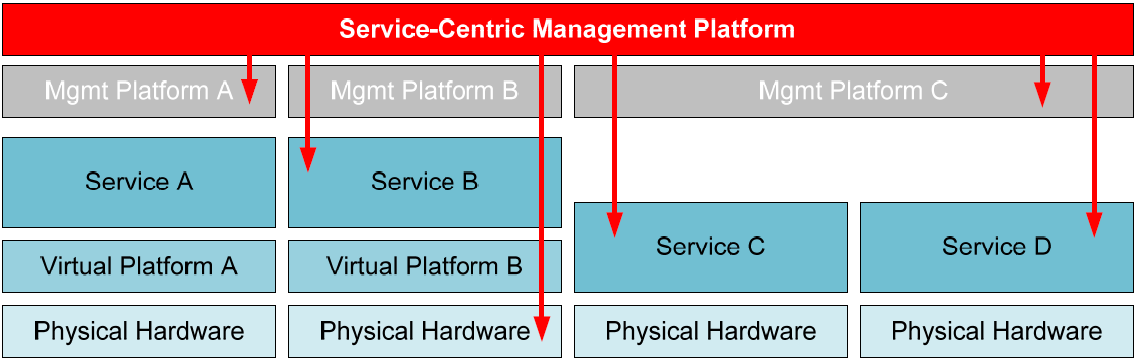
Figure 4.1: The widespread reach of service-centric management platforms means that component interrelations can be identified.
The Impact of Virtualization on Problem Resolution
Stated bluntly, virtualization's impact on problem resolution can actually be to complicate efforts. IT operations have long considered the individual server as the element of primary importance when tracking down problems. When a problem occurs, we jump to the server that hosts the failed service to view its log information or restart failed components. In the Windows world, the usual joke involves whether you've "rebooted the box" or not. In other words, if a problem occurs, step one is to reboot. If that doesn't fix the problem, then move on to more complex troubleshooting.
Whether that process is good policy is left to debate, but virtualization doesn't necessarily change that oft-used first step in fixing the problem. As with physical computers, sometimes the quickest starting point is to simply reboot the computer. What virtualization does do is impact those deeper-level questions discussed earlier. In most enterprise environments, virtualization's first goal is the consolidation of many computers onto few. This reduction of physical server instances in favor of virtual instances means a lower hardware TCO to the enterprise. Yet that consolidation adds complexities all its own to the data center:
- Physical server processor utilization increases. It is common for processor utilization across Windows servers to approximate 5 to 7%. This extremely small percentage effectively means that processor utilization capacity in non-virtualized servers is effectively limitless. The result is that performance impact as a result of processor boundaries is often not a consideration in physical environment troubleshooting today. This reality changes with virtualization's server consolidation in which the goal is to ensure the correct mix of virtual server resource needs to physical host resources. Failing to perform this task well can result in an oversubscription of processor resources as too many virtual machines vie for too few processor cycles.
- Physical server network utilization increases. The typical network utilization across a server's gigabit network card rarely grows beyond a 10% average utilization. Thus, it would take the needs of 10 servers at their average maximum utilization to fully subscribe a card's capacity. In the non-virtualized environment, this is rarely a problem but can become a problem once those servers are consolidated. Another often neglected effect of this configuration has to do with the capacity on networking equipment itself. As full utilization rarely occurs, many network switches and routers cannot support the situation in which each of their ports is operating at full capacity at once. The end result is that a move to virtualization could quietly overburden the network backbone, even though that backbone is overtly rated for the environment's traffic needs.
- Data storage increases as it moves to higher-cost storage. Virtualization hits a doublepunch with enterprises in terms of increasing storage utilization while requiring highreliability and exceptionally high performance. These needs mandate the types of storage that usually come at a high cost. Large numbers of virtual machines can be collocated in the same storage volumes—each requiring near-native speeds and the assurance of near100% uptime—so the cost to the business can be substantial. With that collocation, each virtual machine's utilization of its storage can have an impact on how others use theirs. Thus, monitoring the behaviors of storage use across multiple servers is critical to tracking down some types of performance issues.
- The number of servers under management increases. Virtualization makes easy the process of rapidly adding servers as necessary, making full role isolation a reality (for example, one service per server). Left unmanaged, this ease-of-use can directly lead to massive server sprawl. Although this sprawl is an obvious problem for asset management, it also impacts problem management in particular ways. The more role isolation in an environment means the more servers that ultimately make up a business service. The end result is that troubleshooting a service's problems requires sleuthing across a larger count of servers, which complicates efforts and increases the time required to find the problem.
- Inter-server networking grows more complex. Physical servers usually have what amounts to a singular connection to the corporate network. Thus, the network alone strings each server to the other. The virtual environment changes this setup through the inclusion of virtual networks. These networks enable collocated virtual servers to communicate with each other over the host's virtual switches rather than the network. This setup complicates the environment by adding what amounts to additional "shadow" networks inside each virtual host that must also be managed by network operations. Further, as virtual machines relocate from host to host during load-balancing or failover operations, those connections must be properly monitored and managed as well.
Although virtualization brings a lot of promise to the enterprise organization, at the same time, it introduces a host of additional complexities. Left unmanaged, these complexities can grow over time—with the growth of the virtualized environment—to make the process of problem identification significantly harder. When that process grows more difficult, IT stands to eventually lose its ability to maintain service quality levels and ultimately support the needs of the business.
Problem Identification and Prioritization Needs in Virtualized Environments
Because of these additional complexities that arrive with the implementation of virtualization, IT requires a greater level of due diligence in monitoring that environment. Traditional siloed monitoring solutions grow less effective in this situation because they no longer provide the cross-device and cross-domain integration that is required to truly understand how one component's behavior impacts another.
Consider an example of how virtualization affects cross-device and cross-domain behaviors. With virtualization, many environments are making greater use of network-based storage such as iSCSI for the hosting of virtual disk files. This storage medium is a boon to management as it is inexpensive, easy to set up, and follows the standard rules of network management. It also does not require the additional skill sets and care commonly associated with Fibre Channel. However, iSCSI connections tend to be substantially more utilized than traditional network connections are, as a virtual server needs near-constant access to read and write to and from its disk subsystem.
In this case, a siloed monitoring solution might not illuminate the right problems to the right people should a problem occur. iSCSI runs over the regular network, which is the purview of the network engineer and his or her tools' vision. Its connection to the disk subsystem falls under the job of storage administrators and their team's monitoring tools. At the same time, the server team, who might be the first to see any performance bottlenecks, has no visibility with their tools into the source of the problem. Only through a unified vision such as that gained through the service-centric approach can the perspectives of all three teams track down a problem to its source.
Yet what does this service-centric monitoring solution look like? With its monitoring integrations watching every facet of the IT environment, how does it go about rendering its vision of service health into something that is usable by all administrators and across all silos? Without focusing on any product from any vendor, consider the elements and their interconnections and dependencies in a continuance of this example. This example will look at the entire system, through its servers and storage and down to the network itself. Let's first break down the interconnections:
- Users rely on a business service for the successful completion of their jobs.
- That service relies on one or more virtual machines to run the business service.
- The virtual machines rely on their disks for functionality.
- The virtual machines and their storage rely on the network for their connection to those disks.
- Virtual machines and users alike rely on the network for intercommunication.
With this in mind, it is possible to draw a mapping of dependencies between elements that make up this service. That mapping, which Figure 4.2 illustrates, shows how each element discussed earlier has a reliance on the elements below it for its functionality.

Figure 4.2: The service-centric approach maps IT infrastructure elements together to show where dependencies exist.
Bottom-Up Monitoring Drives Teams to Root Causes
With this mapping in place, it is easy to immediately see how each disparate component works with others to make up what is considered "The Service." If any of the relied-upon components in this mapping experiences a failure, that failure will impact the components that reside on top of the failed component. So, for example, if the storage subsystem experiences a massive failure and goes offline, all virtual machines that rely on it will cease to function. As those virtual machines cease to function, so does the service. When the service goes down, the users are unable to accomplish their jobs and the phones at the Help desk begin lighting up.
In the wholly unmonitored environment, the last step in this story is the first step in the troubleshooting process. IT finds out that a service is down because users call in the problem. Conversely, in the fully monitored environment, IT finds out that that the service has gone down because the monitoring system has notified them as such. This is obviously the much better situation.
Yet there is a critical difference between how this works in traditional siloed monitoring solutions and the service-centric approach. That difference has to do with the bottom-up nature of conditions that combine to define the "health" of the service itself. When all elements of this service mapping are healthy, the service is considered healthy. When one element of the service experiences a negative condition—such as "The Storage" going down—that element is no longer healthy.
At the same time, the bottom-up approach leverages the interconnections between elements in the system to identify that the service as a whole is also no longer healthy. The end result is that troubleshooting teams can quickly drill down from the top level to identify the true source of a problem. This situation is perhaps easiest understood through the example service-centric visualization that Figure 4.3 shows. There you can see how a problem that has occurred in "The Storage" rolls up the tree to illuminate an unhealthy state for the entire service.
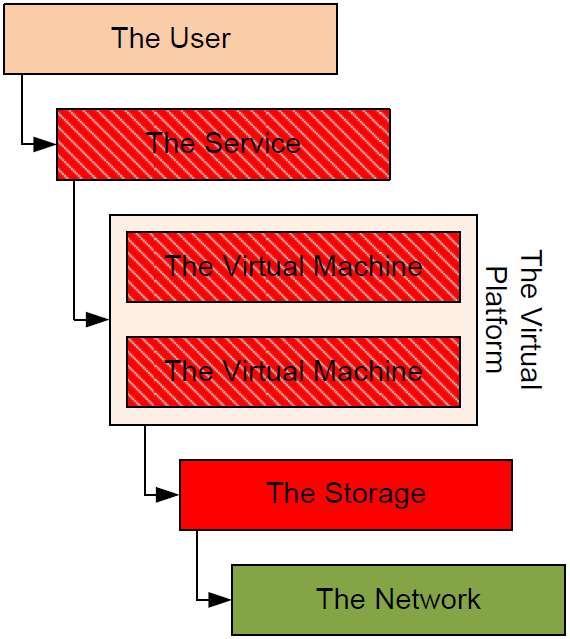
Figure 4.3: The bottom-up aspect of the service-centric approach provides a way to drill down directly to the source of a problem.
The information gained through this bottom-up approach provides a way for IT to see the service, including its virtualized and non-virtualized elements, as the sum of its components. The interrelation of these components further illuminates how the different parts of servers, networks, storage, and all the other "pieces" of the IT infrastructure work together for the processing of business needs. An effective service-centric management solution will provide visualizations of a similar nature.
Considering the added complexities introduced by virtualization that were discussed earlier in this chapter, this illustration should immediately show how such automated monitoring elements become critically necessary. As the level of virtualization in an environment grows, so does the criticality of the interdependencies on each part of that environment to work together in concert. With virtualization, a reduction in quality of a previously unrelated component can now directly impact the functionality of virtual machines and their services.
That being said, Figure 4.3 shows an obvious oversimplification. A service-centric management platform's level of monitoring integration into each element—and its visualizations of the result—is much more defined than simply answering the question, "Is 'The Storage' up right now?" In the service-centric approach, the goal of any particular integration is to collect large amounts of data about the IT component as well as an understanding of its underlying health. That understanding can come through the analysis of one of many factors, including availability information, event log data, and performance measurements. For any of these, when conditions occur that are known to effect server and service quality, service-centric management tools will notify personnel in the way described earlier. The end result is a much quicker call to action when problems occur, and in many cases, a pre-failure notice that a problem may soon occur. The next three sections take a look at these three types of data and how they feed into bottom-up monitoring.
Availability
The simplest piece of information that can be provided by these integrations is the determination of whether the element is operational. In the case of a network device such as a server, router, or switch, its response to a network "ping" query provides basic data as to its availability.
In the case of applications, of which virtualization and its platform-specific management tools are one example, determining availability is more complex than simply recognizing a "ping" response. Effective service-centric management toolsets include integrations that can peer into these applications to determine whether they are functioning. Virtualization platforms can be queried through special requests to their APIs to identify whether their underlying functionality is operating correctly. With a data center's virtualization platform being the base upon which its virtual workloads are hosted, this deep integration is critical towards understanding whether its workloads are truly available.
Event and Log Information
Event and log information provides a second perspective into the health of a system. A system that has not yet gone down but has a problem often reports on that status in its logs prior to an outage. As such, those logs contain important clues as to the status of the server leading up to the point where the outage occurred.
Important to note also is that a downed IT element is not the only situation in which that element can be considered unhealthy. There are numerous conditions on a physical or virtual server that indicate the server is not behaving as desired. For example, a service on that device may have crashed or its disks may be near capacity. The server may not have the correct version of software necessary for its proper functionality in the virtualized environment. Any of these can indicate that there is a hidden problem.
Many of these conditions can be discovered through reading a device's log data. Collecting that data and correlating it to predetermined conditions of health are important for identifying when elements may not be fully healthy and therefore unable to perform their jobs at necessary levels. The result in doing performing this process well is the proactive ability to resolve problems before they negatively affect availability.
Performance
Performance information comprises the third category of critical data to be collected. This guide has discussed numerous times the need for effective performance management upon the move to virtualization. Virtualization's goal of consolidation means that performance is much more highly bounded by available resources. As such, the deep monitoring of per-virtual machine and per-virtual host performance is critical to ensuring high service quality across the board. In the fully mature environment, this monitoring extends beyond just the server to the network, storage, and other layers of the environment. The goal in monitoring performance is in identifying where performance bottlenecks are impacting the ability of the end user in using the service.
The Power of Bottom-Up Monitoring
In the service-centric approach's bottom-up view, these three elements work together to identify a component's statement of health. Based on rules that are input into the monitoring platform, the movement of any or all of these components away from nominal behaviors will result in a change in health status. Figure 4.4 shows an exploded view of how this might work within our example. In this case, the cause of the example's problem expands a bit to recognize that "The Storage" itself is not necessarily down. By digging deeper, the performance counter for Disk Read Rate is exposed to be above the desired level. Such can be the case when too many virtual machines share disk spindles and are trying to read too much data all at once. In this case, the service's health indicator changes to red to notify administrators of the problem.
With this change, the service-centric management platform will next notify users and may suggest resolutions for the problem. One solution for this problem is to migrate the offending virtual machine's disk files to an alternative disk location where the files do not cause spindle contention with other virtual machines. In the case of highly evolved service-centric management platforms, this solution may be automatically invoked by the system to auto-resolve the problem with no or minimal administrator involvement.

Figure 4.4: This exploded view of the previous figure shows how an identified health failure can be drilled down even further to find its root cause.
Top-Down Monitoring Illuminates the User's Perspective
With all its capabilities, bottom-up monitoring provides but one perspective of your virtual and physical environment. It enables the easy creation of rollup reports that quickly point troubleshooting teams to problems. Yet with all its power in digging through volumes of data to find the exact source of a problem, it does not provide a good sense of how that service is working from the perspective of the user.
Consider the failure situation Figure 4.5 shows in which users employ a virtualized Web server to accomplish their daily business. That Web-based service relies on two other virtual servers for its processing. All data that the Web server renders to a user starts in a separate database, but must first process through a third application server. In this case, the Web server is dependent on the application server, while the application server is dependent on the database. All servers are dependent on the network for their intercommunication, and all servers are part of the same virtual platform infrastructure. In this fairly common situation, an outage of any of these three servers will immediately result in an outage to the service.
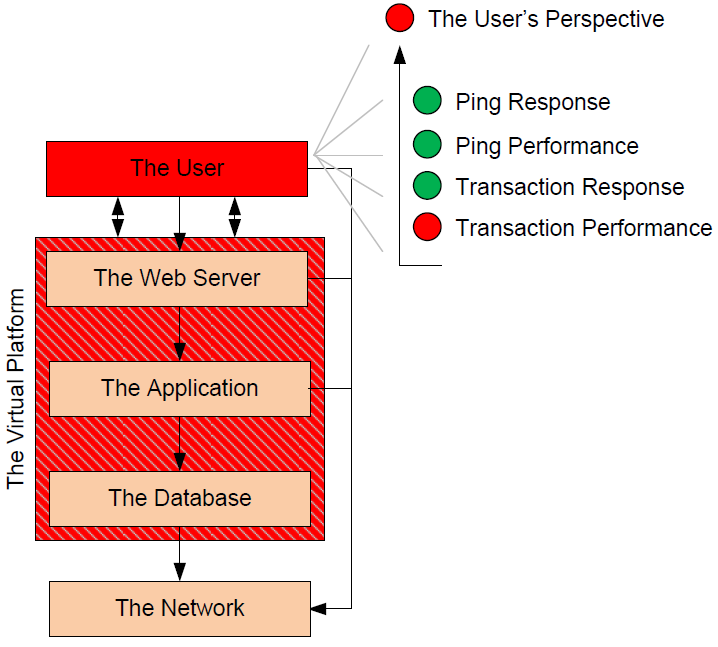
Figure 4.5: The top-down perspective of the service-centric approach looks at the user's experience with applications. In this case, the service's health is poor because of measured client-based transaction performance.
Transaction Monitoring
In the previously identified case, the problem that exists does not appear to be caused by any of the virtual servers that make up the service. From the perspective of each individual server, that server is behaving appropriately and with the correct level of performance. The interconnection between each server and the others it works with is similarly functioning correctly. The problem that has been identified sources not from the servers themselves but instead from the perspective of the user. The exploded portion of Figure 4.5 shows that monitor integrations on the client see a successful ping response and transaction response. They even see good quality in the timing of the ping response. However, the transactions between the users and the Web application are performing at a level that is lower than desired.
This problem is of particular significance in virtualized environments because traditional performance monitoring on a virtualized host may not correctly identify problems that are occurring within the virtualization platform itself. Perhaps, in this case, another entirely separate virtual machine is consuming too many resources, preventing some part of this server from accomplishing its mission in a timely manner. Maybe there is a problem in the network connection between the client and the virtualization platform that requires attention. Addressing these possibilities requires a level of detailed situational awareness that is possible only through deep integrations.
Effective service-centric management toolsets often include the ability to view services from the client perspective. Those behaviors can be determined through the use of monitors that measure either actual or "synthetic" transactions between the user and the service. Real transactions may include those that a standard user attempts to complete while the user goes through typical workday processes. "Synthetic" transactions are instead pre-generated transactions that have a known result and require a known amount of time to complete, which makes it easy to calculate their timing for performance measurements. These transactions can be scheduled to run at regular intervals without changing the service's data to identify when conditions exist that result in a degradation of service.
Virtualized environments that host highly critical applications should strongly consider the use of top-down monitoring. This type of monitoring can assist IT teams with understanding how the complexities of virtualization's interconnections ultimately impact the experience of the end user.
Invoking Remediation Actions
Obviously, once problems are identified, one must then switch gears to enact their resolution. Having all this monitoring in place is only useful if it can draw the troubleshooting administrator to an ultimate conclusion on what change to make to the environment. The processes discussed to this point in this chapter all relate to the identification of the problem. Once that problem is identified, some change to that system component is usually necessary in order to bring the component back to health. There are three main ways in which service-centric solutions typically go about this process: Manual changes, semi-automated changes, and fully automated changes. The differences between these three classes of changes are important in terms of how they are initiated:
- Manual changes. Manual changes are those that are completed by an administrator directly on the system itself. In this case, the service-centric management solution may identify a problem and suggest a resolution. The administrator may then connect to the virtual machine through its remote interface or directly to the console of a physical device. Once there, the administrator will resolve the problem. An example in this case is when a virtual machine begins to run out of disk space. Once notified, the administrator then directly works with that virtual machine to add disk space.
- Semi-automated changes. Semi-automated changes are different in that they are initiated from within the service-centric management platform. Using the platform's tools, administrators gain the ability to enact changes or run tests directly from within the platform's user interface. When properly developed prior to the problem, changes such as these can be enacted very quickly and without the resource overhead associated with manually logging into the problematic system. Unlike fully automated changes, semiautomated changes actually require an administrator to invoke the change. Following the previous example, administrators may identify a mechanism to script or otherwise code the process of adding disk space to a virtual machine. Once coded, that action is added to the management platform's user interface where it can be invoked by an administrator when the issue occurs.
- Fully automated changes. When environments grow to high levels of maturity, they begin to more fully understand the nature of their services under management. With that understanding comes the organizational knowledge necessary to begin coding fully automated corrective actions based on known conditions. In this case, when monitoring integrations identify a negative behavior that has a known solution, the service-centric management platform automatically invokes the associated corrective action. Continuing with the disk space example, a mature organization that has a high level of trust in automating the addition of disk space may instruct the system to simply invoke the action when the incident occurs.
Figure 4.6 shows an example of how this fully automated change might work in a service-centric management platform. In the example that the figure shows, one of the four monitoring integrations has turned red due to the virtual machine's database running out of disk space. The process to add disk space to a virtual machine can be coded through its platform-specific management API. When the condition occurs the system automatically invokes the action "Add Disk Space." This action attempts to add disk space to the virtual server's database drive, the completion of which will resolve the primary failure condition.
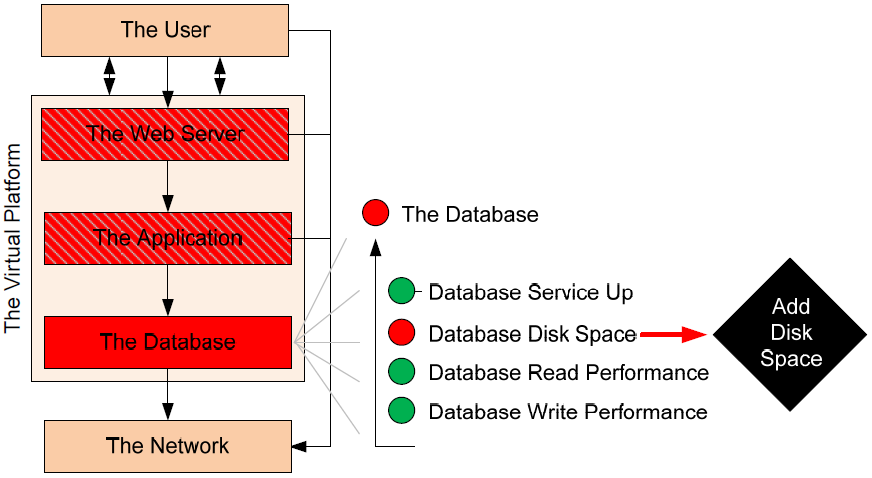
Figure 4.6: Remediation can take the form of fully automated actions that are invoked when known conditions occur.
Depending on the service-centric management platform selected, automated actions may be invoked based on a combination of failure conditions, priority, and administrator selection. Encoding actions such as these often requires some level of development, though many common actions may be already available through the platform's interface.
It is worth mentioning that changes such as these should be logged into the organization's CMDB using the same CAB processes as identified in the previous chapter. The "Problem Resolution" step of problem management has a large tie into change management practices as well. An effective service-centric management platform will include the necessary integrations—especially in the case of semi- or fully automatic actions—to log changes into the organization's CMDB.
Obviously, moving from the invocation of manual to semi-automatic to fully automatic actions requires a correspondingly greater level of understanding of the system and its behaviors. Trusting the system to automatically identify when disk space is low and to then automatically add space requires experience with both the problem and its exact resolution. Rare is the organization that will immediately be able to implement a service-centric management solution that automatically begins invoking actions as necessary.
Needed skills in this case are the deep understanding of behaviors that can exist within a service as well as the development abilities to create actions that correctly accomplish the necessary tasks. Care must be taken with any movement to fully automated actions in that their invocation does not cause more harm than good to the environment.
Run Book Automation Sequences
One way to accelerate the process by which these actions are created is through their modularization. In this case, individual task steps are coded into the system on a task-by-task basis. An individual task or "module" can be invoked as necessary for the accomplishment of its change to the system. Or, in the case of more complex resolutions, it is possible to string together a series of task steps into what is called a "run book." This run book is comprised of the series of tasks. Information from one task can be used to feed data into the next.
Run books are created out of existing actions, so their integration into CMDB, service desk, and CAB processes can be more streamlined than with custom code.
Run books provide a mechanism for administrators to break down the actions that are commonly run against a service component so that those actions can be later reconnected in different combinations. This process brings flexibility to the creation of new tasks without a lot of rework. Figure 4.7 shows an example of how multiple task modules can be strung together to create an entirely new action to be run against a failed system. In this case, the "Add Disk Space" action that was used in the previous example is actually comprised of three actions that extend the disk that is assigned to the virtual machine and then extend the volume within that disk before rebooting the virtual machine.
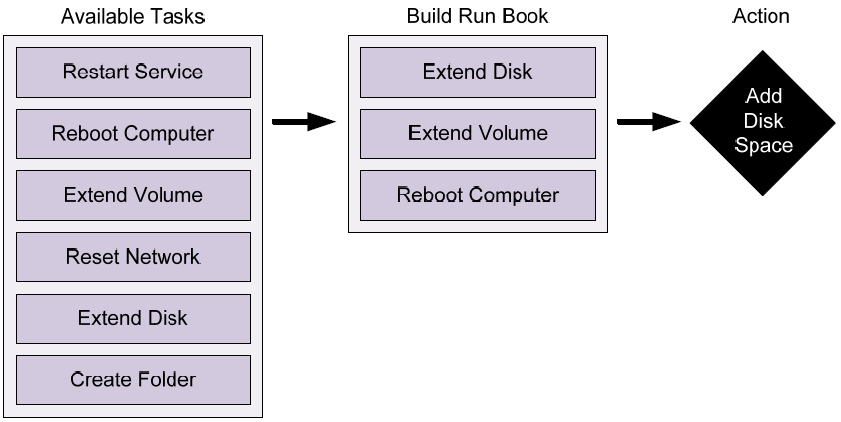
Figure 4.7: A run book for the automated "Add Disk Space" action can be created out of separate tasks.
Benefits of Automating Problem Identification and Resolution
All these actions need to occur because they bring some benefit to the business IT environment. In the end, having all this monitoring in place has no reason unless it enables IT to better identify and resolve problems as they occur. Further, it is easy to see how problem identification can quickly morph into problem prevention as the level of monitoring scales to all the elements in the IT environment.
Although these benefits work for all the components that make up IT, this guide has attempted to focus on those that are specific to virtualization. One take-away from this approach is that although the addition of virtualization to the environment changes the way in which resources are used, services are run, and administrators accomplish their tasks, there are many similarities between how physical and virtual machines can be managed. Virtualization's promise is in the levels of added automation that it brings to the table. That automation works because of those three tenets introduced back in Chapter 1. When it comes to problem identification and resolution, those three tenets remain true:
- Flexibility in virtualization means that otherwise manual actions can be highly automated because they are run through the virtualization management APIs. Problems with virtual devices are also often exposed through that same API. The result is that many common problems can be identified and resolved by monitoring at the layer of abstraction.
- Transience in virtualization means that problems that occur within the virtualized environment can often relate to all virtual machines in that environment. As such, remediation actions can be quickly scaled to all virtual machines as necessary, which has the effect of speeding recovery.
- Commonality in virtualization means that virtual machines are highly similar to each other, which reduces the complexity of individual systems within the environment. The result is the potential for higher levels of uptime in well-managed infrastructures.
All of these tenets are valuable to the organization that properly manages their environment. The right tools and management platforms enable IT to keep an eye on conditions all around the environment and enact change when necessary. The service-centric approach is one way to accomplish that with an eye specifically towards the health of services. Integrating the servicecentric approach to your virtualization environment brings about a set of benefits that are valuable to the enterprise:
- Alignment of IT capabilities and business demands. The service-centric approach provides monitoring integrations that look across all the elements in the IT environment, enabling the analysis of their health and performance across devices. Being focused on the performance of business services, the service-centric approach automatically feeds data to IT that aligns them with the quality of the services they are providing to the business. This alignment takes IT from its historical past of device-centrism to a future where business needs are quantitatively analyzed in comparison with available resources.
- Assurance of service availability. Services must be available if they are to be used. Virtualization alone provides added technology that goes far in assuring high levels of uptime. Coupling virtualization with a service-based strategy for monitoring and problem resolution means that those highly available services are watched in the best ways possible.
- Prioritizing resources for resolution. When a service goes down, its loss of functionality immediately begins impacting the business bottom line. Employees cannot accomplish their stated tasks. Customers cannot interact with online systems. Businesses cannot operate. The service-centric approach enables troubleshooting teams to quickly identify when service behaviors deviate from norms and to quickly recognize which areas require first focus for resolution.
- Service level management incorporation and data validation. Virtualization and its management tools provide substantially greater levels of data than those in physical environments toward the fulfillment of Service Level Agreements (SLAs). When that data is collected through tools such as the service-centric platforms discussed in this guide, it is easy to create visualizations that automatically provide a heads-up display of service levels. Such displays do not require costly and error-prone manual collection of data, which frees IT for more valuable tasks.
- Trending, analysis, planning, and continual service improvement. The data collected for the fulfillment of service levels can further be used in analyzing trends in usage and performance over time. That analysis gives the smart IT organization the information it needs to make effective planning decisions. With the virtual environment's abstraction of resources into "pools," this data enables IT to more accurately identify when additional resources are needed.
- Efficiency in time to resolution. Lastly, the merge of virtualization with effective management tools provides a mechanism for quickly bringing problems to resolution. That has been the major thrust of this chapter. When management tools have the right level of data and the correct actions available, problems can be resolved quickly—even before users experience an impact.
Virtualized Environments Managed Through Automation Toolsets Enhance Agility
This guide has attempted to show how the combination of virtualization and effective management toolsets can be a significant enhancement to data center operations. It started with an understanding of the core competencies of service management and how virtualization dramatically changes the game in providing services to users. That explanation then moved to a discussion on how service management itself is enhanced through the augmentation of virtualization with proper service-centric management platforms. The final two chapters documented the all-important change and problem management processes as they can be viewed when the right technologies are laid into place.
The goal of this guide is to show how high levels of enterprise automation can be achieved with the right mix of technology, process, and data gathering through monitoring integrations. The end result is a greater level of agility on the part of IT in managing the environment, identifying problems when or before they occur, resolving those problems, and doing so with the proper change tracking and configuration control. As a result, the statement that started out this guide should have a much more significant meaning:
Without the right integration into your enterprise's business processes, virtualization is little more than technology hype.
Your next step will be to find that correct level of integration of virtualization into your business processes. Only then will you see the greatest level of return out of your virtualization investment.