The Power of Business Service Management
Its 2:15am on Monday morning and First Class Glass (FCG), a global distributor of high-end automotive and industrial glass products, is about to experience a server outage of a "minor IT system" at its Denver data center. But this is no standard outage…
With domestic data centers in Denver and Baltimore as well as international operations in Geneva, Switzerland and Osaka, Japan, IT Operations for FCG has hundreds of interconnected systems and network devices under management. With rare exception, each of these systems is monitored under the watchful eye of First Class Glass' monitoring and notification system.
What's different about today's outage is that the alert for this minor IT system in Denver actually got lost in the daily shuffle of alerts and notifications brought up by FCG's network management system. The alert for the "minor IT system" was categorized with a very low priority and was missed by FCG's monitoring help desk. So, this outage will go unnoticed for nearly 6 hours before IT in the Denver office begins arriving for the Monday morning grind.
When IT personnel in charge of the system begin arriving at around 8:00am, however, they do notice the outage of this "minor IT system," identify the problem with the hosting server computer, and resolve the problem with little effort. In their chart of system priority, FCG's IT recognizes this system as having a Tier III criticality level. Within the Service Level Agreement (SLA) they've agreed upon with the business, FCG's Tier III systems must be brought back online within 8 hours. Since the problem began at 2:15am and was resolved prior to 10:15am, IT sees the problem as within the scope of its SLA and writes off the problem as fixed to agreedupon standards.
These sorts of problems happen every day in IT. With the complexity of today's environments the number of interconnected devices, virtualization, SOA, etc. -outages and degradation of service on any network is a regular occurrence for networks both large and small. And over the years, IT organizations have developed a finely tuned sixth sense for finding and fixing problems within their networks.
But the problem with IT and the way IT handles the identification and resolution of those problems is in its infrastructure-centric focus. IT, by definition and by charter, concerns itself with the functioning and non-functioning of infrastructure components. However, the business services that run on this infrastructure are what ultimately make the business function. Let's look a little deeper into today's problem over at FCG.

Figure 1.1: Monday morning's problem with a "minor IT system" actually drove a problem into a much larger enterprise-wide system.
Turns out that the "minor IT system" wasn't so minor after all. In its end-of-month metrics back to the business, FCG's IT reports no SLA violations for the month. Our Monday morning problem didn't rise to the level requiring identification to the business, so IT's "breach report" didn't include the outage. However, what IT never realized is that its "minor IT system" is actually a small component of a much larger enterprise-wide problem.
The business actually felt the problem quite a bit more than IT did because that "minor IT system" was a low-level component of a system thread linking all the way to FCG's Tier I business-to-business (B2B) Web system. This B2B Web system handles all the purchasing, returns, and delivery information for FCG's glass purchases worldwide. The role of the minor IT system is to feed special-order delivery routing information to a moderate data processing system that in turn feeds into the site's returns subsystem.
FCG's 6-hour outage between 2:15am and 8:15am caused all incoming special orders to crash at the most delicate step in the process—after the order had been taken and charged but before it was completed with routing and delivery information. Because of that error, any special orders received within that 6-hour period were charged to customer accounts but no delivery or routing information was captured.
The end-result of today's problem is that the ordering department must undergo a timeconsuming and manual process to identify the failed orders and work with each customer individually to populate its delivery and routing data. This manual process costs the business money—at a cost level typically associated with a Tier I outage.
You can see in the example the dissonance between the IT's priorities and those of the business. What IT sees as a "minor IT system" actually affects the business in a highly critical way. IT is not necessarily at fault for their mislabeling of the system. They're doing their job the best way they can. Where the fault lies is in the essential translation from the priorities for IT and those for the entire business.
Adding to today's problem is the global nature of FCG's business. Though the problem occurred between the early hours of 2:15am and 8:15am (MST) in the United States where virtually no B2B business is being transacted, business was only just beginning 9 hours ahead in Europe, the Middle East, and Africa (EMEA). Sixteen hours behind, Japan and the rest of Asia-Pac are just finishing their days. Understanding the business calendar and business periods means recognizing how time shifts affect a globalized company.
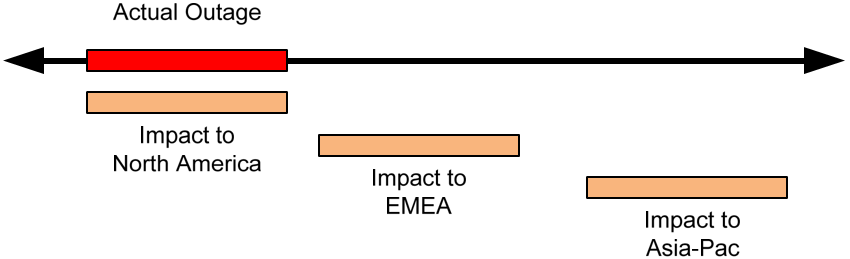
Figure 1.2: Tracking FCG's problem along a graph of time shows the skew created by time zones. An impact that occurs at 2:15am in one part of the world affects another part of the world in the middle of the workday.
The Intent of this Guide
The intent of this guide is to discuss in detail the issues and solutions associated with true management of a business' systems. This guide will also help IT translate that monitoring into a framework that makes sense from a business perspective. Part of this process of making sense from monitoring data means translating it into terms that non-technical business leaders can understand.
We'll talk about the dissonance between IT's perception of monitoring and how that perception sometime misses the mark of what truly interests a business. We'll discuss how a top-down approach to monitoring business systems can provide a solution set to overcome that dissonance. We'll go into the operational aspects of measuring your infrastructure's availability and performance, not only from the perspective of the IT employee but also from the perspective of the customer. That measurement will include metrics that validate or invalidate the success of the network in terms of providing and hosting services that ultimately run the business.
All these conversations relate to a way of thinking about systems management that turns the traditional approach on its head. This collection of tools, technique, and technology is called Business Service Management (BSM), and they enable the business to understand how it is impacted by IT. It provides a framework of real-world solutions for monitoring, reporting, and notification that make sense and provide value to those outside the IT organization—its business leaders.
By the conclusion of this guide, you will be comfortable with the concepts and the implementation of BSM, what it impacts and what it doesn't. You'll understand the managerial, operational, and technical value of implementing BSM in your environment. And you'll know exactly what you need to do to properly plan, design, and incorporate BSM methodologies into your daily workflow.
Business Service Management—More than a Framework
Let's start off with a formal definition of BSM, courtesy of Gartner, and then throughout the rest of this chapter we'll deconstruct that definition into its individual elements: BSM is a category of IT operations management software products that link the availability and performance status of IT infrastructure components to business-oriented IT services that enable business processes.
BSM is effectively a mechanism by which the goals of business are applied to the technology of IT. With BSM, IT goes about a reconfiguration of the way it considers technology—adding to the traditional device-based approach it begins embracing a service-based approach to monitoring. This embrace of technology in terms of business services means that individual outages are treated as profit-and-loss events for the business. A loss in a subsystem to a business service feeds into the total quality of that service. A reduction in the performance of a system reduces its quality. And, most importantly, a decrease in response time for a customer-facing system reduces its service quality.
The idea of a "framework" signals to the reader that this concept incorporates a suite of ideas. Those ideas encapsulate an understanding of the concept, its inputs and outputs, and the computations that it performs upon its data. Unfortunately, all too often, some concepts rarely get out of the framework phase. They don't turn into useable products.
BSM is more than just a framework. It is a fully defined category of software and implementation guidelines. It ingests availability and performance data and outputs qualityrelated metrics to the business on the health of the network's business services. BSM applies a dollar value to the reduction in quality for each identified service and serves up that information on dashboards viewable and understandable to both IT and business leaders. Taking it one step further, BSM represents the combination of Monitoring + Money.
The Chasm Between IT and the Business
Chapter 2 will provide a much more detailed discussion of the alignment between IT and the business. That chapter will discuss how IT is maturing past the days of pure firefighting and the break/fix mentality and will talk there about the differences in vocabulary and prioritization that can be inhibitors to attaining a high level of organizational maturity. But let's take just a minute here to talk about the dissonance between the mindset of the IT guys in the basement and the executives on the top floor.
For most of the early years of computers and networking, IT organizations have used rich tools to monitor the status of computer hardware and software. Utilizing such technologies as SNMP for network and UNIX devices, Windows Management Instrumentation (WMI) for Windows devices, Java Messaging Services (JMS) for Java applications, or any of the many Web Services protocols, systems administrators have been able for years to query network-attached devices for status, inventory information, performance metrics, and active configurations. Connecting these technologies to a centralized Network Management System enables the IT department to build a single-screen view into the network.
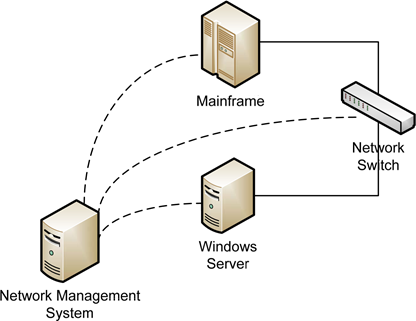
Figure 1.3: Mature IT organizations have for years incorporated Network Management Systems to monitor and notify when network-enabled devices incur problems.
That single-screen view helps to enlighten IT as to the health of the network and the devices and applications that make up that network. If a device goes down, the Network Management System notifies the administrator through a pop-up alert, an email, or a page to a mobile device that the system has gone offline. Help desks everywhere have installed heads-up displays where green lights go red when bad things happen.
When criteria for performance are preconfigured into the system, the same Network
Management System can notify administrators when performance dips below preset thresholds. Highly mature IT organizations even define auto-remediation actions to occur when preconfigured events occur. A mature IT shop has probably been proactively monitoring such elements for years.
Where the chasm occurs is in the definition of what's important. IT tends to deem the status of each individual device important. If a device is up, the light stays green. Business leaders have different priorities, though. For a business leader, importance is best measured by customer satisfaction, external service availability, and the capability to meet customer needs. If a customer completes a Web site transaction and is satisfied with the results, the business leader's light stays green.
But who really owns the service and is responsible for its quality? Is it the business leader who pays for and relies upon the service? Or is it the IT organization that watches it, manages it, and ensures it remains up and operational? According to BSM, it is a combination of the two. With BSM, and the tools that feed its framework, each half of the ownership is provided with the information it needs to make the best decisions within its universe of control. Table 1.1 highlights some examples of this idea.
Elements Needed by IT | Elements Needed by Business Leadership |
Device availabilities | Service quality |
System performance metrics | Customer wait time |
System performance thresholds | Customer drop rate |
Network latency percentages | End user experience metrics |
Table 1.1: With BSM, information about a system and the services that reside on that system is broken down into elements useful to its stakeholder.
What Is a Business Service?
Before we can go too far into this explanation of the information needed by each stakeholder in the business, we need to talk a little about the definition of a business service. Obviously, not all services and applications on the network are those that can be categorized as "front-line services" or even services that feed front-line services.
Part of the identification of network services requires building a catalog of services. This creation process identifies the network-based services and applications provided by your business that in some way impact its profits and losses. Those services can be externally facing ones to your customer base. They can be external B2B services. They can be internal services used only by internal employees in the operation and processing of customer accounts. Or, they can be internal services used for purely internal purposes but whose outage could cause an inability to complete daily activities in the line of business.
For the purposes of BSM, the identification of a business service at its most basic form is one whose operation can be quantified in terms of dollars and cents. If a service can be measured by some amount of cash that moves during its processing—and therefore is missing when it fails to be processed—then it becomes a good candidate for a business service.
Where the complexity arrives in defining such services comes in finding the lines of demarcation between individual services. This process of breaking down a business service into its disparate components is the next step in the BSM process and is really the most critical activity. Some sample questions to consider:
- Do we consider our order processing system a single business service? Or can we break down the system into an order entry service, an order processing service, and an order notification service?
- Is our external Web site a business service? Does it provide quantifiable cash flow?
- Is our internal Web site a business service? Will the loss of it impact our ability to complete the daily flow of business, and if so by how much?
- Is the functioning of our internal Windows domain a business service? What functions rely on its faithful operation?
- Which of our network devices and applications are most critical to operations and which power only tangential operations?
You can see here that breaking down these services into ever smaller and smaller subcomponents can be a daunting task. But it is the interrelation of these interconnected service subcomponents that eventually builds what BSM calls a service model. If each business service subcomponent is akin to a city on a map, the service model is the complete map including all the roads that connect those cities.
BSM's service model lies at the core of its processing power. It is within the BSM service model that dependencies between services are described and where individual service subcomponents are logically interconnected.
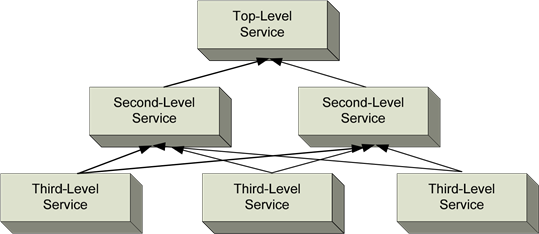
Figure 1.4: In BSM's service model, services and service subcomponents are atomized and interconnected to show dependencies. Upper-level services rely on lower-level services for functionality. The Quality of Service (QoS) of lower-level services drives the QoS for those above them.
Figure 1.4 shows an example of six business services. Each of these business services has a quantifiable point of demarcation. Services at the bottom provide data processing of some form useful to services that lie above them. Services above others below them require those subordinate services to function properly.
The preceding model diagram shows a single core service. Generically, that service could be The Company eCommerce Site. This business service is the ultimate endpoint in which the business interacts with the customer, or essentially that portion of the internal network that the customer sees. But that service relies upon a set of dependencies to function properly. Perhaps the two second-level services are The Ordering Database and The Customer Database. Each of these, in turn, relies on other subordinate services. These third-level services could be abstractions for real network constructs such as The External Network, The Customer Authentication System, and The Data Encryption System.
What is critical in determining the points of demarcation between such services is that they are not necessarily aligned to network objects or individual applications. We do not define our service model as The Network Switch that connects to The Network Database Server that itself feeds The eCommerce Server Cluster. Instead, BSM requires that for most services, you add a level of abstraction between the physical network object or application and the business processes that it enables.
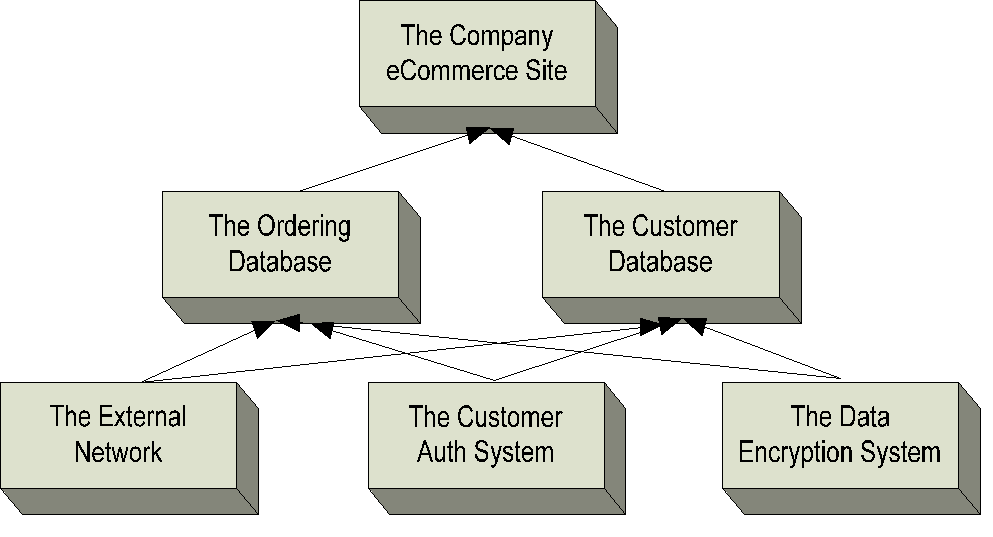
Figure 1.5: Filling in the blanks from Figure 1.4, you see how business services interrelate.
Example Business Services
All this said, to help clarify the role of the business service in building the BSM service model, let's take a look at some example business services. We'll continue with the example that started off the chapter. In the example for the global glass company, the service that died overnight was a low-level service residing on a forgotten server in the Denver data center. But the service provided by the computer that faulted tied into a much greater system unbeknownst to the IT organization. The total quality of FCG's mission-critical B2B Web system was reduced by the loss of this low-level system, without registering sufficiently in the IT group's management system. Let's flesh out the diagram from Figure 1.1 and remove the icons that show individual systems to get a better picture of how example business services might interconnect to feed a B2B Web system.
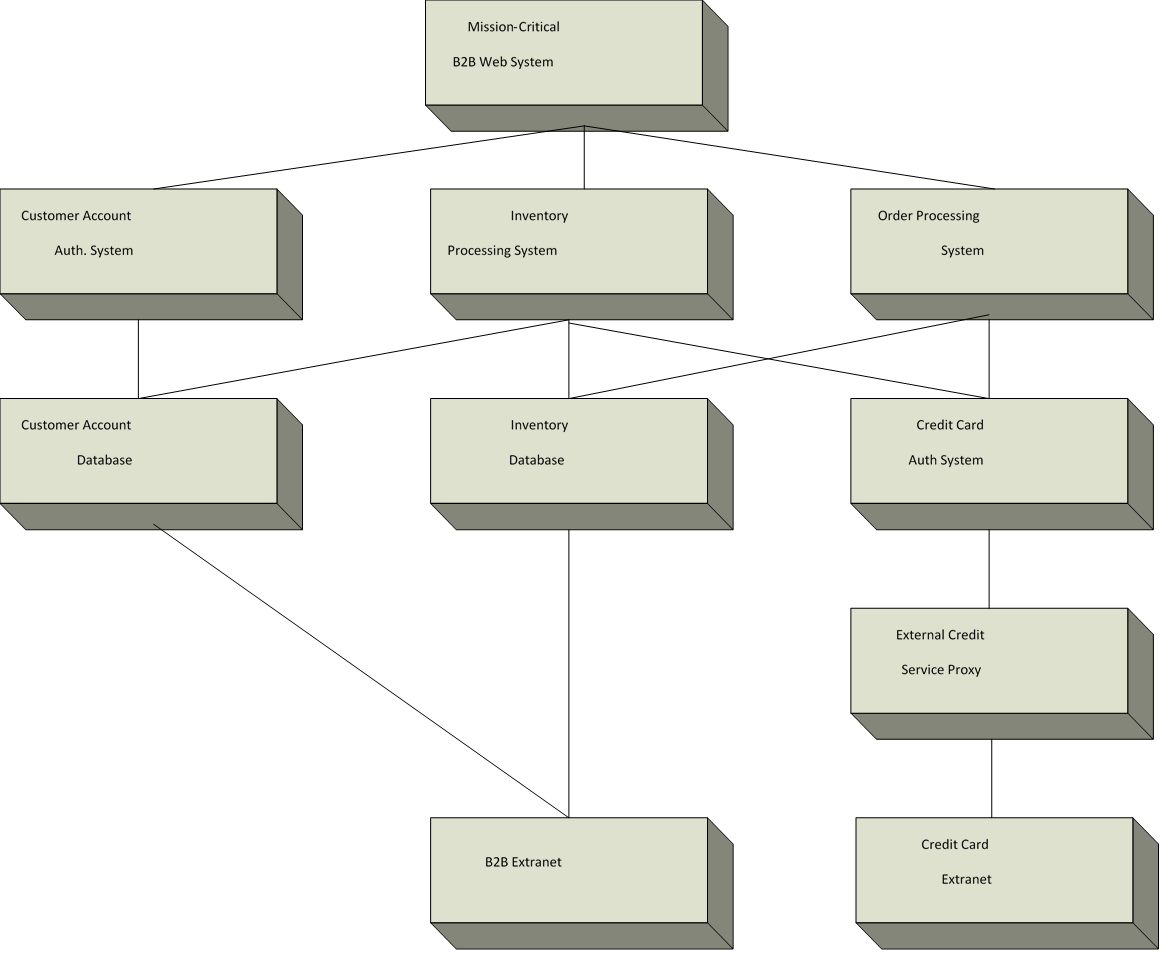
Figure 1.6: A more detailed service model outlines the discrete functions of FCG's mission-critical B2B Web systems and the dependencies between them.
Figure 1.6 shows the example business system broken down into its various logical components. Each of these components resides on one or more physical devices within one or more data centers. But, more importantly, each of these components is critical in some measurement of the operation of the B2B Web system.
Immediately related to the core system itself are its Customer Account Authorization System, the
Inventory Processing System, and the Order Processing System. The Customer Account
Authorization System is used to store customer credentials using its dependent Customer Account Database. It also allows for the authentication of customers using the B2B Web site. Its related database stores account personalization information as well as logins and passwords.
The Inventory Processing System is used to manage the workflow associated with recognizing inventory levels and acting on the information it gets from its dependency, the Inventory Database. The Inventory Processing System also updates customer personalization information within the Customer Account Database to note previous orders and to suggest potential future orders.
That same Inventory Database also works with the Order Processing System. The Order Processing System's responsibility is to ensure that a customer transaction is completed and logged correctly when requesting a unit of inventory. Because all orders in the example system are paid for via credit card, the Order Processing System depends on the Credit Card
Authentication System to process credit card information. An External Credit Card Proxy is used to complete those transactions. Two separate networks are relied upon for the functionality of the entire system. Those are the B2B Extranet and the separate Credit Card Extranet that is FCG's connection to the credit card provider. You should immediately see the complexities involved in deconstructing what seems a simple business service into its component elements.
Managing Business Services
As you can see in the preceding example, the core service relies upon numerous services to function. This is one of the major tenets of BSM. From the customer's perspective, they see only one of three possible outcomes when they attempt to connect to the B2B Web server:
- Acceptable Service—The customer logs into the system, receives a successful logon within an acceptable amount of time. They navigate through the system to find the items of interest, also within an acceptable period of time. Once ready to complete their transaction, the purchase is completed using a payment method of their choosing that responds quickly and without exposing error, delay, or security compromise to the customer.
- Unacceptable Service—Throughout any period during the customer's shopping and/or browsing experience, they may experience a noticeable reduction in performance. That can be considered by them to be unacceptable service quality. When this occurs to the point where the customer feels the service cannot handle their requests, they may stop using the service.
- Unavailable Service—The customer may be able to successfully login, receive a successful authentication, and begin shopping for items. But because multiple subsystems must be present and functioning to complete the transaction, they may not be able to successfully complete their entire desired task—in this case, finding the items of interest and purchasing them. Or they may be unable to login or even browse the Web site owing to a component failure.
With BSM, the monitoring and notification tools present in the suite need to provide information to both IT and business leaders that actively validates the state of the service in real-time. Is the B2B Web site currently in State 1 or has it degraded to State 2 or even State 3? And, if the service has degraded to an unacceptable state, what impact in whole dollars is experienced by the company per period of time?
Another of BSM's key benefits is its ability to better troubleshoot service degradation as it occurs. When the service model is built with a high level of granularity and end user experience metrics are configured into the system, BSM provides an excellent mechanism for drilling down into specific problem sets. As 80 percent of troubleshooting is often just finding where the problem lies, this feature speeds problem resolution. Chapter 5 will discuss the benefits and key components for end user experience monitoring.
To help you further understand the role of BSM in defining these states and the notifications that occur when state changes happen, let's look at Gartner's further definition of BSM and what is needed for a software package to qualify as a BSM tool:
To qualify for the BSM category, a product must support the definition, storage, and visualization of IT service topology or dependency maps. It must gather real-time operational status data from underlying applications and IT infrastructure components. And it must process status data against the object model to communicate real-time IT service status.
Thus, managing business services means ingesting real-time status data from the physical systems that make up business services and translating that into the abstracted service model. That data can come from any number of places—system-based, application-based, or even codebased, such as via Java, SAP, or CMDB API interfaces.
Once the data arrives, it is the job of the BSM system to apply predefined logic to that data to determine the quality of each system. All this information is pushed in real-time to the communication mechanisms (alert notifications, dashboards and reports) defined by the administrator. I'll talk about those mechanisms in a minute.
I haven't yet talked about the underlying applications and IT infrastructure components that a BSM system relies upon for its monitoring data. Chapter 5 will do so and Chapter 8 will provide another discussion in greater detail. However, it is worth mentioning that a BSM tool need not be the tool that creates monitoring data. A BSM tool need only be capable of ingesting monitoring data and acting on that data using the notification concepts that make up the BSM framework. Furthermore, BSM is not intended to be a service catalog itself. Nor is it alone business activity monitoring or a business process automation tool.
Before leaving the topic of managing business services, it is important to take a quick look at what business services are not. Because the focus is so heavily on abstractions of physical constructs into business processes and the health of those business processes, mirroring business services to already defined business processes is an effective mechanism for encapsulating them.
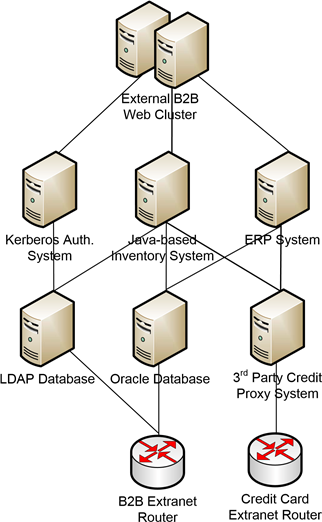
Figure 1.7: Although BSM can incorporate elements of physical infrastructure into the service model, it is not intended to be an IT-centric view of the overall system. This image is therefore an incorrect abstraction for the example B2B service.
Conversely, the incorrect way to abstract the business service is via a purely IT-centric or devicecentric approach. Doing service modeling in this way is no different from standard IT service management. It serves only to provide the viewer with a device-centric view of the health of the business service and complicates efforts to understand how the service impacts customer satisfaction.
Dashboards and Service Visibility
Once the service model is developed, you need some mechanism for reporting status and experience information back to interested stakeholders in real time. BSM's implementation of this status and experience data is through dashboards. These dashboards are customized for the interests of their viewers. In other words, the same monitoring data that informs the IT department about an outage in a "minor IT system" must be refactored to be useful to a business executive.
Taking the explanation one step further, let's look at what data is of interest to each party. The IT department is interested in the name of the server that went down. Even better for them is when the monitoring system can inform IT why that server went down and the event log error that immediately preceded the outage. This information is consumed by IT in its activity to restore the server to health and aids the troubleshooting process involved in pursuing that activity.
For a business executive, knowing the name of the system that went down or the event log error that preceded the system crash is irrelevant. The business executive is not likely to care about any of this. What is of concern, however, is the impact that a server's outage has on the ultimate profitability of the business as a whole and the business's ability to serve its customers.
One of BSM's central tenants involves the digestibility of the information provided. If the BSM system can provide information related only to downed server names and log data surrounding an event, an executive is not likely to pay attention to that system. If the system can provide digestible information to the executive—the name of the business service affected, the number of whole dollars associated with the reduction in QoS, and how that service's outage affects other services—the executive will be empowered to make educated decisions.
The tenet of digestibility for visualization tools is crucial. Dashboards must be customized for each class of user. It's worth saying that dashboards are not purely an internal function. With BSM, the creation of dashboards for external entities is valuable as well. Picture the last time your customerfacing Web site experienced an outage. Did your customers see a cryptic HTTP 404 error or did they see real-time status information about the problem and anticipated time-to-fix?
Elements of BSM
This guide is broken into 10 chapters, each of which will discuss one facet of BSM. Intended to function as interdependent building blocks, each chapter draws on its predecessors to flesh out the BSM picture. As you can see in Figure 1.8, these building blocks start with a description of the as-is situation in most IT cultures. We'll sidestep into BSM's value proposition related to many network's existing deficiencies and move through the implementation activity with a side conversation on the experience of the end user. The guide will then branch into three ways to add management, operational, and IT value, and conclude with a discussion linking BSM with other management frameworks such as ITIL and Six Sigma.
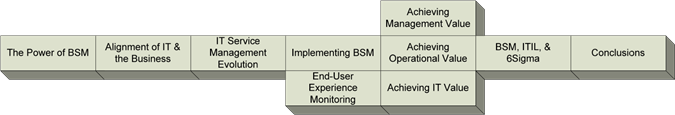
Figure 1.8: The chapters of this guide incorporate building blocks to guide the conversation towards a full understanding of BSM as a viable and effective solution.
Alignment of IT and the Business
The relationship between IT and the business continues to improve. But as with personal relationships, there are always some differences in the language that both parties use. Techies are genuinely interested in the underlying technology that drives an infrastructure. This can be skewed or even inverted from the underlying needs of the business from that same network. Chapter 2 will talk about the alignment between the priorities of IT and the business and how the priorities of IT sometimes don't match those of the business.
When misalignment is present and IT doesn't understand the true needs of the business, an end result is that they can seek out solutions unrelated to the problem's true criticality. Conversely, when they are aligned, IT is better able to understand where and how they should apply their efforts. This goes the same for purchasing decisions. With BSM, business services are "up on the board" much more overtly, which ends in better recognition of where limited funding should be applied. Chapter 2 will discuss how BSM can be a motivating force in the maturation of IT.
The Evolution of IT Service Management
Once you begin that process of identifying alignment issues, you can work towards a resolution by identifying a framework for that effort. Chapter 3 will discuss views on the state and future of IT organizations. It will talk about the evolution of service management, from its roots in server performance through predictive analysis and end user experience monitoring and on up to BSM. With this understanding of the evolutionary process, the chapter enters into a discussion about how it best enhances the total operational posture of the network and the services that lie on top of it. It will conclude with examples of service management at each point in the evolutionary process and link to service level expectations and reporting needs.
Implementing BSM
Closing out the introductory material on the status of IT and its need for mature tools like BSM, Chapter 4 will begin the process of explaining the design, installation, and configuration tasks required to stand up a BSM instance in your environment.
The chapter will discuss the seven steps of a BSM implementation, starting with design tasks all the way through implementation and constant improvement phases:
- We begin with the Preparation Phase where project plans are outlined and project teams are identified.
- In the Selection Phase, you assess critical and measurable business services using the criteria discussed earlier in the chapter and analyze each service's cost to the business.
- The Definition Phase takes the input from the Selection phase and makes key decisions on which services to bring under management immediately, which to delay, and which to remove from the project scope.
- The Modeling Phase begins the process of data collection. Here, you tie identified services into existing or new monitoring tools for data gathering and begin the process of building the service model.
- Once the initial service model is created and data gathering is complete, you continue into the Measurement Phase. This phase involves itself with the measurement of services over time, identification of gaps in monitoring, and validation of costing assumptions.
- The Data Analysis Phase ingests the data gathered in the Measurement phase and completes more rigorous analysis on that data to begin building fault and impact analysis models.
- Once the IT organization understands the complexities of the business services as identified by data analysis, the Improvement Phase helps to determine where remediation actions can improve the environment. This phase has the potential for excellent return on the BSM system by identifying and ultimately fixing performance or other issues that are causing service quality reductions.
- Lastly, you implement the key Reporting Phase, where dashboards and other visualization tools are implemented for key stakeholders to use.
End User Experience Monitoring
One of the major components of BSM is its ability to enhance the administrator's view into the experience of the user. Administrators and business leaders alike rarely have the time to manually check and verify the functionality and palatability of customer-facing business systems. Thus, automation components that can constantly repeat this verification and alert when out-of-bounds conditions occur is critical to ensuring the QoS and maintaining customer satisfaction.
Chapter 5 will discuss the needs and the enabling technologies that provide for end user experience monitoring on systems that impact the company's bottom line. The chapter will talk about how BSM can link with Web front-ends, packaged applications, thin clients, middleware, and even databases to find problems deep down in the software code. We'll discuss the link between end user experience monitoring and BSM and show how experience monitoring directly affects the ability of the business to service its customers well.
Achieving Management Value
Chapter 6, the first of three chapters about getting value out of a BSM solution, will discuss the components associated with management. Not only management in terms of "managers" and the value proposition enabled through their added vision into highly technical environments but also the management control that such visibility empowers them to use. Too often in IT, the technical people are incapable or unwilling to communicate with management on the true status of their systems.
The chapter will discuss how management can enable such a check-and-balance using BSM. It will also discuss how BSM, and specifically the visualization components of a fully realized BSM infrastructure, can help right-size contracts for outsourcing, service providers, and internal IT organizations within the scope of their SLAs. Through the use of quantitative visualization, SLA contracts can be positively verified. In cases in which contracts are tightly bound by those SLAs, this ability to "prove what's right" enhances negotiation proceedings.
Achieving Operational Value
Chapter 7 offers a conversation on the operational benefits of a BSM system. Through a welldesigned BSM system, a business can reduce operational expenditures through better planning and forecasting vision. BSM can also serve as a management umbrella under which unified controls such as management tools, notification, automated and partially automated remediation tools, scripting, and reporting engines can reside.
The chapter talks about how BSM enhances the operational visibility of services including enhanced situational awareness, better outage planning within global operations due to business calendar processing, and problem resolution prioritization based on customer need. The chapter will go into great detail about the processes and best practices associated with building effective dashboards. We'll explore the key needs for business management, for IT, and for customers. Each of those groups of people has different needs and different data of interest, so designing dashboards to meet their needs is one of the most critical components in any best-in-class BSM infrastructure. The chapter will conclude with a review of sample dashboard elements that bring graphical impact when visualizing monitoring data.
Achieving IT Value
No conversation about the value proposition of an IT system is complete without discussing how that system provides value to IT itself. Chapter 8 does just that. IT's needs for management and monitoring are well established. However, BSM provides heretofore unrecognized additional value through its unique way of looking at data. The chapter will discuss the business, service desk, configuration, response time, and infrastructure metrics data available to IT within a fully realized BSM implementation.
It will then dig deep into the IT technology that BSM implementers must understand to link the
BSM system into other systems on the network. We'll explore management protocols such as SNMP, WMI, WS-Management, enterprise messaging, and the Java messaging service and how these tools are necessary for BSM to link into system data. The chapter will be complete with a review of the data collection capabilities of a best-in-class BSM system and how these external data sources connect to BSM.
ITIL and Six Sigma
BSM is a top-down, phased approach that first considers what's most critical to the business. Its framework for deployment is based on industry-standard practices. Two of these industry practices, ITIL and Six Sigma, compliment BSM to provide tangible return on investment. Combining ITIL, Six Sigma and BSM provides rich capabilities for continual quality improvement with a focus on the business.
Chapter 9 will discuss the ties that connect ITIL and Six Sigma with BSM. It will talk about the practices and how they interrelate and how a business can use built-in BSM tools to populate Six Sigma thought-driving and planning discussions. The chapter will also discuss ITIL and Six Sigma best-practice metrics that are importable into a BSM infrastructure to immediately gain the benefits of these complementary ideas.
Important Definitions
The next nine chapters will begin the process of educating you on the needs, processes, and benefits involved in building BSM into your network. But before concluding this chapter's review on high-level topics, let's take a few minutes to discuss important key concepts that you'll encounter again and again throughout this guide. This section introduces concepts specific to BSM and BSM implementations that will help you understand the necessary underlying technology and processes associated with BSM.
Business Impact Management
Business Impact Management (BIM) is the idea of network management that monitors the status of IT devices but not necessarily from a device-centric approach. BIM tools track QoS across multiple devices but report on a service as a single entity that relies upon those devices.
Where BIM tools differ from traditional management and monitoring tools is in correlating performance and event data across multiple IT facets for a roll-up view on business system health. As an example, a traditional management tool may be able to notify administrators when the network is slow or inoperable. But a BIM tool can wrap this performance shortfall information with data from the application itself to get a holistic view of the entire system performance.
Service Level Management
Service Level Management is an ITIL construct that defines the process of constructing, adjudicating with stakeholders, implementing, and documenting an agreed-upon level of service for a particular IT system or subsystem as well as the management of the customer relationship. The following list highlights examples of Service Level Management:
- Service Level Management can occur between an IT organization and the business to outline the specific and quantitative expectations of service quality to be provided for by IT.
- It can occur between the business and its customers, contractually outlining expectations for service levels from the business to its hosted customers.
- It can be contracted between a business and its resource providers. This might seek to ensure that the business obtains the QoS it requires to provide services to its customers in turn. It can also provide a basis for contractual remediation when the business does not receive the contracted level of service.
- Should include OLAs .
- Penalties avoidance (for providers) and customer satisfaction are factors as to why organizations have SLM in place.
Service Level Management typically deals an organization's service catalog and performance metrics associated with those services.
Real-Time Service Visualization
A proper definition of Real-Time Service Visualization requires the term to be broken down into its two halves and defined piecemeal:
- Service Visualization is the idea of providing a graphical abstraction of a business service and the quality associated with that business service. Service Visualization is used to encapsulate the concept of the service itself into a single-picture view that explains the service, its current operation, and any issues associated with that service.
- Real Time means simply that the data involved with a system is not snapshot-based but is instead abstracted to relevant visualization tools as it arrives into the system. Real time is best contrasted with traditional report-based data, which arrives to the consumer after collection and preparation.
Real-Time Service Visualization is the idea of providing a graphical abstraction of a business service and the health and quality of that service. Key to the generation of that data is that the information provided to its consumer within the abstraction is an instantaneous representation of momentary status.
Operational Metrics
Operational Metrics are those metrics used to represent the day-to-day health and quality of a particular business service. Operational Metrics are typically measurements of status and performance over time based on the behavior of a particular business system. These metrics are concerned with the availability of a business system, its throughput and observed performance, and its response time. Operational Metrics are used most often to understand the technical quality of a system.
Service/Asset Metrics
Service and Asset Metrics are those used to identify, inventory, and generally understand the physical characteristics of a particular service or asset. These metrics can be used to understand the characteristics and effectiveness of individual services or assets and potentially drive decisions as to their utility, efficacy, necessity, and reusability.
Business Metrics
Business Metrics are those that relate an item, a process, or an activity's function and processing to how it impacts the financial position of the business. For items, business metrics can relate to its age, its utility, and various elements of financial return on the item. For processes and activities, this can relate to the efficacy of the process to produce value and/or the quantification of any value provided by the process.
Executive Views
Executive Views are constructs within dashboard views that are specifically tailored for consumption by non-technical business leaders. Executive views are critical components in a mature BSM solution because they empower executives with the knowledge they need to validate the health and quality of a business system. The BSM tenet of digestibility emphasizes the ability for executives to understand, or digest, the information contained within their visualization tool.
Fault Trees
A Fault Tree is a visualization tool used in a Fault Tree Analysis. In these diagrams, an undesired effect is listed as the root of a logic tree. Each potential situation that could add cause to that undesired effect is listed on the tree as branches towards its root. Subsequent situations that add cause to upward-level causes are connected below cause items. Fault Trees are useful in the identification of root cause for a particular problem and help with the visualization of the current and future potential situations to identify and track affecting problems in a system.
Impact Trees
Impact Trees are used as a visualization tool in identifying what connected systems could be impacted by a fault within a particular system or system subcomponent. The element at the bottom of the tree is typically the faulted item and all objects connected upwards from that item are recognized to be in a faulted or partially faulted state.
One of the added benefits associated with the creation of the service model is the built-in knowledge of how services impact each other. Thus, an Impact Tree can be created easily by utilizing the service model's interconnections.
Business Calendar
When an organization expands to global operations, that organization inherits the intrinsic time skew that occurs across numerous and far-flung time zones. Because of this time skew, the time frames for activity on network devices and applications change drastically. Because employees or customers may reside in significantly separated time zones, activities on the network can impact different geographical regions at different times of day.
The Business Calendar defines not only the operational periods of a service, but also takes into account scheduled downtimes, as well as the importance of the various schedule periods, such as peak, off peak, etc. The business calendar is time-zone aware, so truly global services can be modeled and supported. The business calendar functionality also can automatically work out the calendars of the supporting infrastructure from the business systems.
Process Integration
Process Integration encapsulates the idea of combining the processes from two separate entities into a single, cohesive business activity. Process integration between disparate elements of a system or disparate systems can involve the integration of the individual actions or code of those systems. Across multiple business partners or between partner and customer, process integration can involve data manipulation and activity manipulation to ensure that the outward data flows from one organization correctly meet with the inward data flow of another. Use of industry standardized processes helps to alleviate the cost associated with integration as both organizations or system elements will utilize equal or equivalent mechanisms for ingest, processing, and output of process data.
Workflow
Workflow is the sequence of steps necessary to complete an action while following the business and technical rules of the acting organization. Workflow for a particular process can entail the positioning of data, its processing, approval for that processing, the completion of tasks associated with the data, and the logging of the activity's completion as well as other steps in the process.
Workflow includes the processes intended to guide data from its creation, through its use and storage, and until its destruction. Integrating workflow rules with BSM means that elements brought to operator attention can be adjudicated according to predefined rules and stored for later referral.
Six Sigma
Six Sigma provides "a quantitative methodology of continuous process improvement and reducing costs, by reducing the amount of variation in process outcomes to a level suitable for the given organization. It pursues data-driven, fact-based decision-making in which decisions are tied to corporate objectives. It uses an implementation of measurement-based strategy that focuses on process improvement and variation reduction" (Source: Six Sigma for IT Management, Sven den Boer et al, June 2006, Page 15).
ITIL
ITIL is a framework of best practices that can be used to assist organizations in developing their IT Service Management process-driven approaches. ITIL recognizes five principal elements that give guidance on the provisioning of quality IT services and the processes and facilities needed to support them: Service Strategy, Service Design, Service Transition, Service Operation, and Continual Service Improvement.
BSM Empowers Decision Makers
This chapter's introduction of the concepts of BSM is intended to drive the idea that BSM is an enabler for decision makers. By laying BSM atop an existing network, leveraging existing monitoring and management frameworks, and using a standardized implementation process, business leaders and other non-technical decision makers become empowered to better understand their network environment. That empowerment assists them in better aligning IT goals with those of the core business.
BSM's real-time and historical visualization components improve decision making and aid in forecasting for future purchase decisions. It speeds the troubleshooting process by quickly identifying root causes. And, most importantly, it serves to expand the vision of all involved to ensure that all-important customer satisfaction is kept at the highest levels possible.